
Figures & data
Table 1 Characteristics of the patients who were included in the analysis
Table 2 Summary of DNA repair genes analyzed with their average fold changes and P-values
Figure 1 Quantitative reverse transcription polymerase chain reaction analyses of messenger (m)RNA expression changes of homologous recombination genes. Data shown are the average of two separate quantitative reverse transcription polymerase chain reaction assays. Genes of interest were normalized to GUSB transcript levels and are presented as fold changes relative to normal matched samples. EME1 transcripts are increased in EAC samples.
Abbreviations: SEM, standard error of the mean; EAC, esophageal adenocarcinoma.
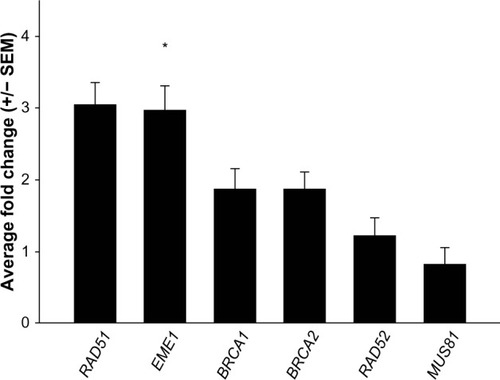
Figure 2 EME1 messenger (m)RNA expression in individual esophageal adenocarcinoma samples, showing three tumor samples display more than fourfold overexpression of EME1.
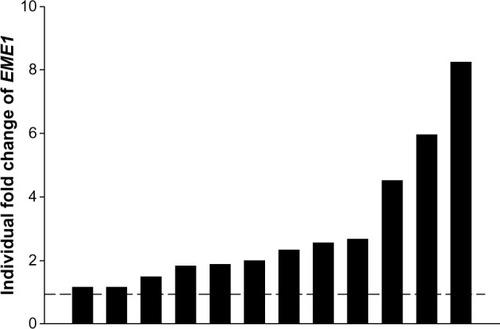
Figure 3 EME1 immunohistochemistry in gastroesophageal junction adenocarcinoma. (A) Well-differentiated gastroesophageal junction adenocarcinoma shows uniform strong nuclear staining pattern with EME1 (250×). (B) EME1 staining intensity was noticeably less in the less differentiated areas (500×). Note the nuclear immunoreactivity for EME1 in a control of benign endometrial stroma (inset).
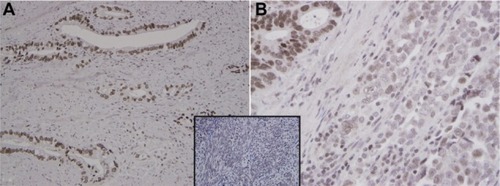
Table 3 Summary of Oncomine database search results of tumors with increased EME1 expression
Figure S1 Taqman endogenous control assay used to determine the optimal housekeeping gene. X axis shows samples used, Y axis showed Ct values of each gene.
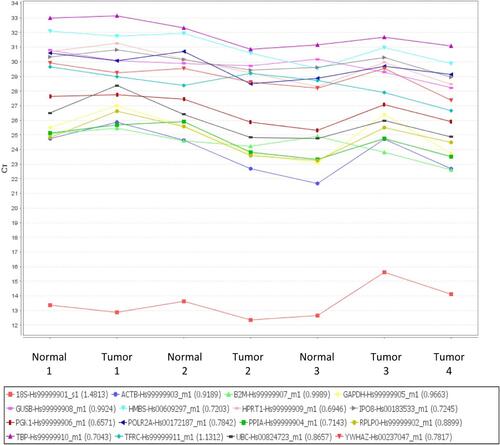
Figure S2 Western blot analysis evaluating EME1 primary antibody in HeLa, WI-38, and SK-GT4 cell extracts. One major band can be seen at expected size of 65 kDa in both HeLa and SK-GT4 cell extracts. The band is present but much weaker in the WI-38 cell line.
Abbreviation: GAPDH, glyceraldehyde 3-phosphate dehydrogenase.
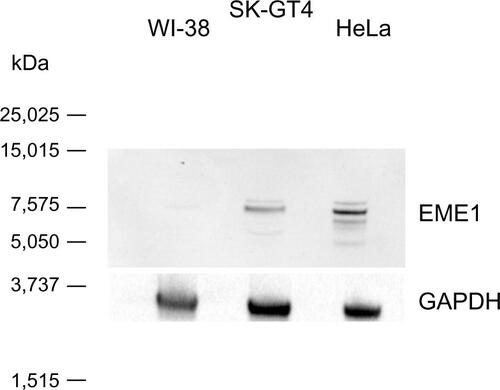
Table S1 Summary of messenger RNA expression of homologous recombination genes in three tumor samples and their biological duplicates
Table S2 Summary of results of EME1 messenger (m)RNA and EME1 protein expression in each of the individual esophageal adenocarcinoma samples