
Figures & data
Table 1 Patient characteristics (N=85)
Table 2 Treatment (N=85)
Table 3 Post-protocol chemotherapy
Figure 1 Kaplan–Meier curves (solid line) of all participants (N=85).
Notes: (A) Progression-free survival (PFS); and (B) overall survival (OS) of gemcitabine and vinorelbine treatment with 95% confidence band (dashed lines).
Abbreviation: CI, confidence interval.
Abbreviation: CI, confidence interval.
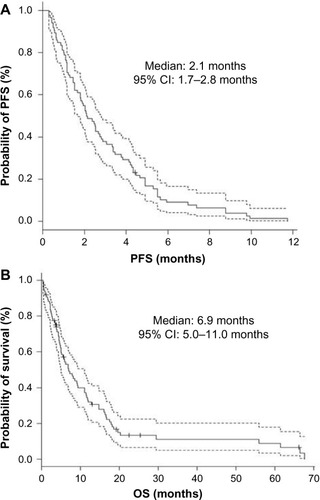
Figure 2 Kaplan–Meier curves (solid line) of third- and further-line chemotherapy (N=72).
Notes: (A) Progression-free survival (PFS); and (B) overall survival (OS) of gemcitabine and vinorelbine treatment with 95% confidence band (dashed lines).
Abbreviation: CI, confidence interval.
Abbreviation: CI, confidence interval.
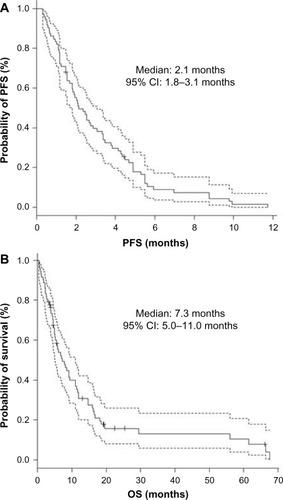
Table 4 Efficacy (N=85)
Table 5 Adverse effects (N=85)
Table 6 Univariate and multivariate Cox proportional hazard analysis of factors influencing progression-free survival (N=85)
Table 7 Review of prospective studies of combination chemotherapy of gemcitabine and vinorelbine for pretreated patients
Table 8 Review of prospective studies comparing combination chemotherapy of gemcitabine and vinorelbine with platinum-based regimens