Figures & data
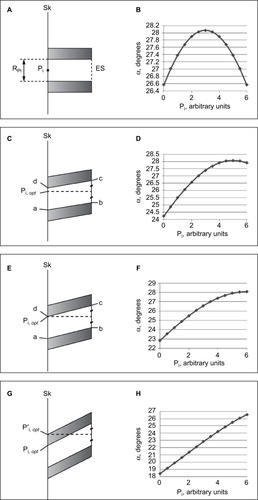
Figure 1 The adopted geometrical model: two adjacent spinous processes represented by two parallelograms.
Notes: Two adjacent spinous processes (A) are represented by two parallelograms (B). The following variables were chosen in the model: θ, d, and L, representing the angle of the spinous process relative to the skin (Sk), the distance between two adjacent spinous processes and the length of the spinous process perpendicular to the skin, respectively. α represents the range of angles at which it is possible to reach the epidural space by a needle inserted at point Pi.
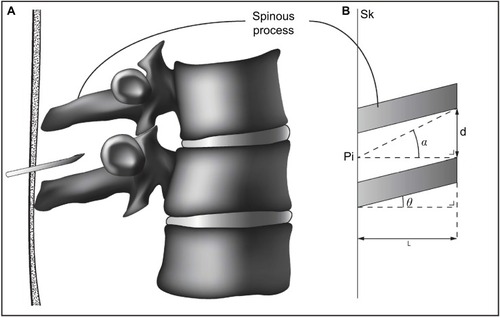
Figure 2 Two adjacent spinous processes are depicted (shaded areas).
Notes: The patient’s skin surface is represented by Sk. Points A, B, C, and D represent the edges of the boundaries of the space between two adjacent spinous processes. Variables x and y were attributed to A, B, C, and D; for point A xA and yB, and similarly for B, C, and D. The needle is inserted at point Pi (xPi, yPi). All points were placed in a grid. The range of angles at which the epidural space or subarachnoid space can be reached is represented by α, which was calculated as follows:

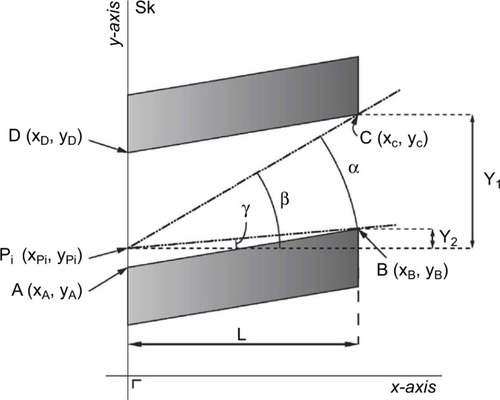
Figure 3 Four sets of two adjacent spinous processes and their corresponding plots are depicted.
Notes: Four sets (A, C, E, G) of two adjacent spinous processes are depicted (shaded areas). The right column shows the corresponding plots (B, D, F, and H). Sk (left part) represents the skin that directly overlays the tips of the spinous processes. RPi (A) represents the range on the Sk where the needle could be inserted. This range corresponds to the x-axis in the corresponding plots (right part). Since only the relative sizes of the parts of the spinous processes are relevant for all calculations, we choose to express Pi on the x-axis in arbitrary units. The lower the value of Pi, the more caudally the needle is inserted. Pi (A) represents an example of a place to insert the needle. To the right of the dotted line is the epidural space (ES) (A). In (C), the reconstruction of point Pi where α is at its maximum is shown. The dotted horizontal line divides the interspinous space between point b and c in two equal parts. The projection of this line on the skin represents the point where α is at its maximum (Pi,
opt). Note that here, Pi,
opt is slightly caudally from the most cranial point of insertion that is possible (ie, point d in [C]). The corresponding plot (D) shows a top (Pi,
opt) and then declines. In (E), Pi,
opt corresponds to point d. This means that α is maximal when the needle is inserted at the most cranial point. When the spinous processes run even more steeply (G), this projection coincides with a bony part of the spinous process (P’i,
opt) where insertion of the needle is not possible. Under these circumstances, Pi,
opt is, as in the situation in (E), at point d.