Figures & data
Table 1 Patient demographics
Figure 1 Ultrasound image of the chest wall – the ribs and pleura are identified. Tilting the ultrasound probe allows for visualization of the border between ribs, intercostal, serratus anterior, and latissimus dorsi muscles to allow for proper placement of local anesthetic and/or catheter.
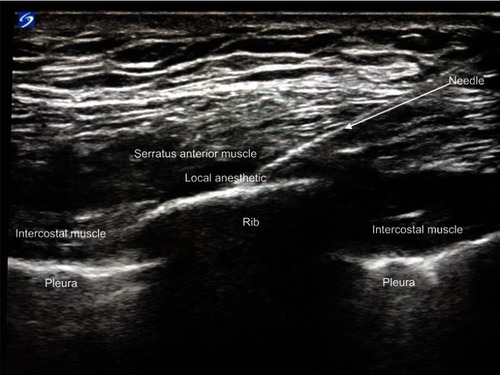
Table 2 Baseline clinical variables and change from baseline in pain score, incentive spirometry (IS) volume, respiratory rate, and pulse oximetry (difference between post-serratus plane block [SPB] value and baseline value).
Figure 2 Pain scores–pain scores before and after SPB are depicted by boxplot. Changes in pain score (N=33) were analyzed by the Wilcoxon signed rank test. Bonferroni adjusted correction was applied to control the overall type I error of six comparisons. P-value is <0.001.
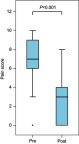
Figure 3 IS before and 4 hrs, 24 hrs, 48 hrs after SPB is depicted by boxplot. Changes in IS from baseline (N=28, 25, 21 for 4, 24, and 48 hrs, respectively) were analyzed by the Wilcoxon signed rank test. Bonferroni correction was applied to control the overall type I error of six comparisons. P-values are <0.001 at 4 and 24 hrs. P-value at 48 hrs is 0.001.
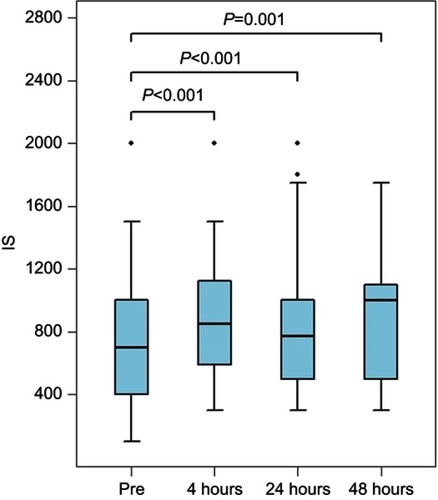
Figure 4 Respiratory rates before and after SPB are depicted by boxplot. Changes in respiratory rate (N=34) were analyzed by the Wilcoxon signed rank test. Bonferroni correction was applied to control the overall type I error of six comparisons. P-value is <0.001.
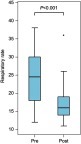
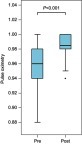
Figure 5 SpO2 before and after SBP is depicted by boxplot. Changes in SpO2 (N=34) were analyzed by the Wilcoxon signed rank test. Bonferroni correction was applied to control the overall type I error of six comparisons. P-value is <0.001.