Figures & data
Figure 1 Illustration of epidural waveforms representing (A) strong, (B) weak, (C) weak with respiratory pattern and (D) absent. When accessing the presence of a positive waveform in the weak category, greater attention should be focused on details, as the vertical height of the amplitude of waveform is reduced.
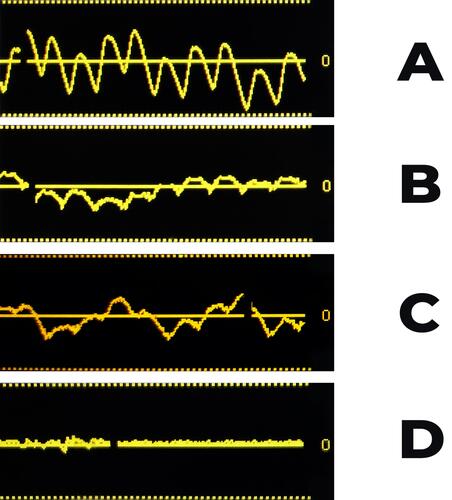
Table 1 Sensitivity, Specificity, Positive Predictive Value (PPV), Negative Predictive Value (NPV) and Accuracy Concerning the Ability of CCDDS Technology to Detect and Display the Pulsatile Wave Form Found in the Epidural Space
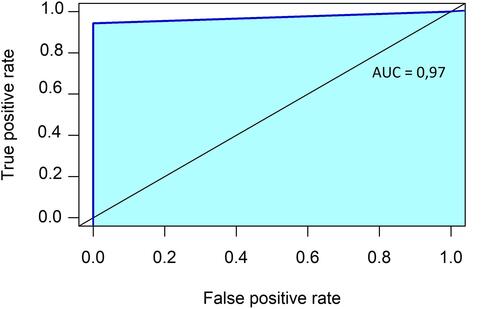
Figure 2 Area under the curve (AUC).