Figures & data
Table 1 Demographics Data of the Sample Set
Figure 1 (A) Original ultrasound image of brachial plexus. (B) Freehand selection of nerves . (C) ImageJ image with overlaying grid. (D) Graph used to compare the position of the nerves of the brachial plexus.
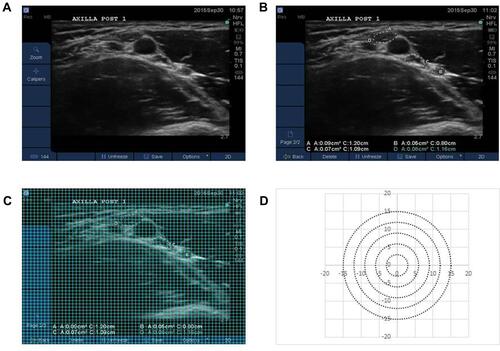
Table 2 Mean and Standard Deviation (SD) for the Right and Left Hand Side and Males and Females for the Four Nerves of the Brachial Plexus
Table 3 Correlation Between Nerve Size and BMI and Age. PCC: Pearson Correlation Coefficient
Figure 2 The position of each of the nerves of the brachial plexus in males and females.
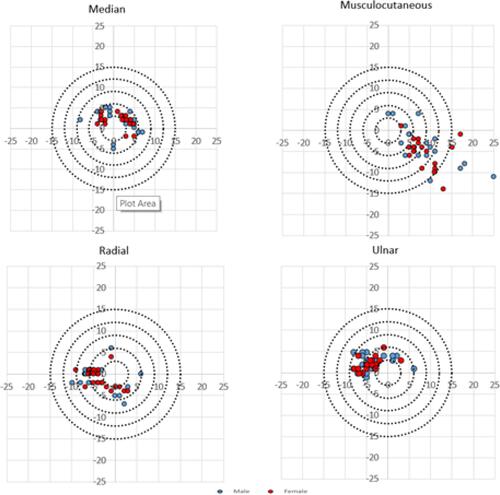
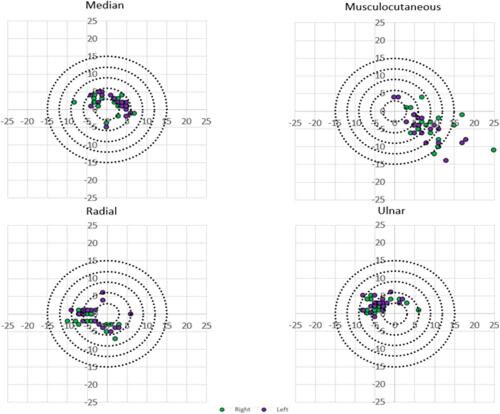
Figure 3 The position of each of the nerves of the brachial plexus on the right and left hand side.