
Figures & data
Figure 1 Participant flow chart of 60 female patients with breast cancer who underwent modified radical mastectomy were assessed for eligibility for our study. Twenty-patients in each group with no patient rolled out. Group (C): Control group (N=20) Group (M): magnesium sulphate group (N=20). Group (K): Ketamine group (N=20).
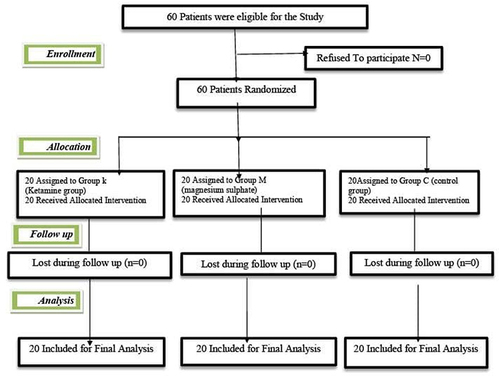
Table 1 Demographic and Clinical Data of the Three Studied Groups
Table 2 Number of Patients Requested Rescue Analgesia, Time of First Request of Analgesia, Total Morphine Amount Requested Among the Three Studied Groups During the Study Period (48 h)
Figure 2 Visual analogue scale changes at rest (VASR) of the three studied groups during the study period (48 h). Data presented as median (range); Group (C): control group. Group (M): magnesium sulphate group. Group (K): Ketamine group. Mild outliers are marked with a circle (O) on the boxplot.
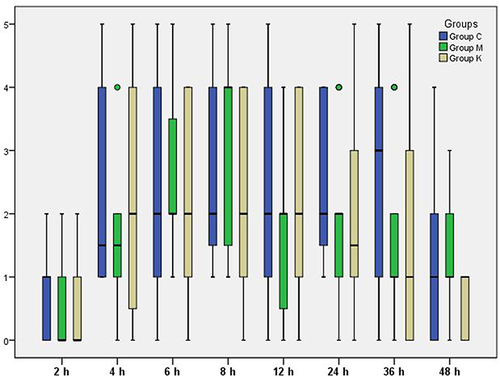
Figure 3 Visual analogue scale changes at movement (VASM) of the three studied groups during the study period (48 h). Data presented as median (range); Group (C): control group. Group (M): magnesium sulphate group. Group (K): Ketamine group. Mild outliers are marked with a circle (O) on the boxplot. Extreme outliers are marked with an asterisk (*) on the boxplot.
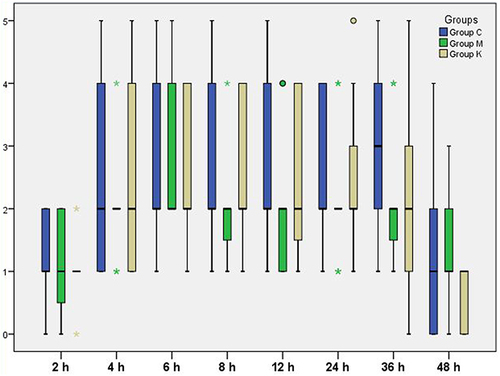
Table 3 Incidence of Side Effects in the Three Studied Groups