Figures & data
Table 1 Demographic, Clinical and Intraoperative Characteristics of the Study Population
Table 2 Comparison of Postoperative Clinical Outcomes Between Therapeutic Groups
Table 3 Comparison of Postoperative Adverse Events Between Therapeutic Groups
Figure 1 Kaplan–Meier analysis of time to hospital discharge according to the type of analgesic intervention.
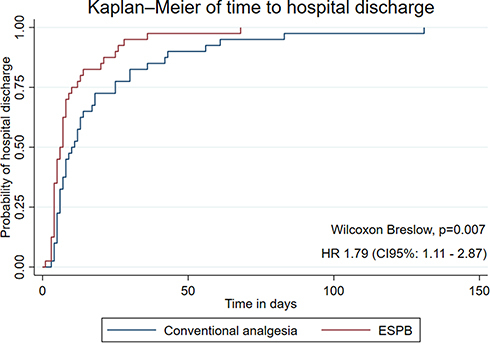
Table 4 Comparison of Unadjusted and Adjusted Hazard Ratios in Multivariate Cox Regression Models
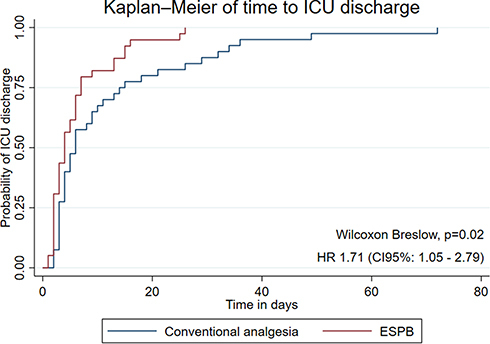
Figure 2 Kaplan–Meier analysis of time to ICU discharge according to the type of analgesic intervention.