
Figures & data
Table 1 Pre- and Post-COVID Symptoms — Questionnaire Completed by Patients Prior to SGB
Table 2 Demographics of Data of the Study Cohort (n = 195)
Figure 1 Data Collected on Google Survey Form.
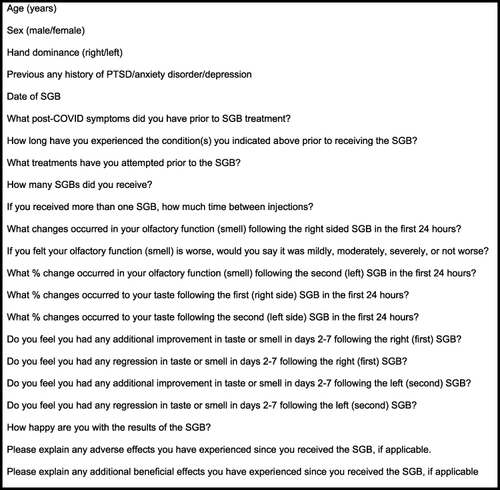
Table 3 Relationship Between Self-Report of Happiness Regarding the SGC Results and Smell/Taste Improvement After Right and Left Sided SGB in the First 24 Hours (n = 195 Each Side)