
Figures & data
Table 1 Hemodynamic differences between IVPCA and IVPCA + TAP groups
Table 2 Postoperative sedation scores during follow-up in the IVPCA and IVPCA + TAP groups
Table 3 Differences in postoperative pain scores between the IVPCA and IVPCA + TAP groups
Table 4 Conventional blood tests for the IVPCA group
Table 5 Conventional blood tests for the IVPCA + TAP group
Figure 1 Bar chart showing the mean and standard deviation values for fentanyl consumption in the IVPCA and IVPCA + TAP groups. P<0.05 indicates statistical significance. A, B, and C show fentanyl consumption on day 1, 2, and 3, respectively.
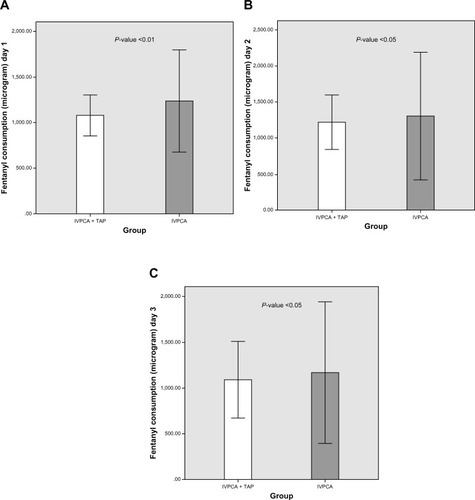
Table 6 Differences in fentanyl consumption in micrograms between the IVPCA and IVPCA + TAP groups
Figure 2 Bar chart showing the mean and standard deviation values for ICU stay between the IVPCA and IVPCA + TAP groups. P<0.05 indicates statistical significance.
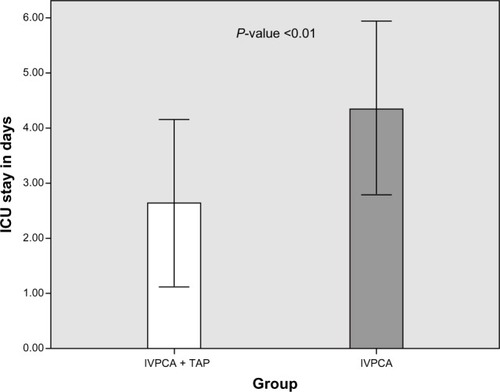
Table 7 Differences in satisfaction scores between the IVPCA and IVPCA + TAP groups