Figures & data
Figure 1 activL® Artificial Disc.
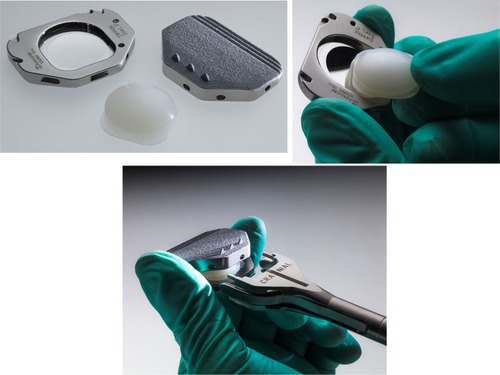
Figure 2 Footprint of the activL® Artificial Disc standard (left) and S1 (right) inferior endplate.
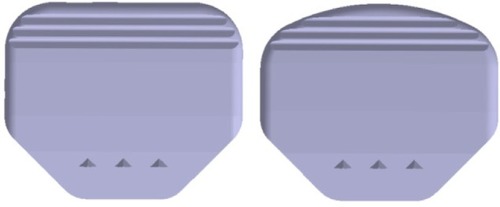
Table 1 Available configurations of activL® Artificial Disc and ProDisc-L Total Disc Replacement
Figure 3 Clinical and radiographic success rates in a randomized controlled trial comparing activL® Artificial Disc to control total disc replacements (ProDisc-L or Charité).
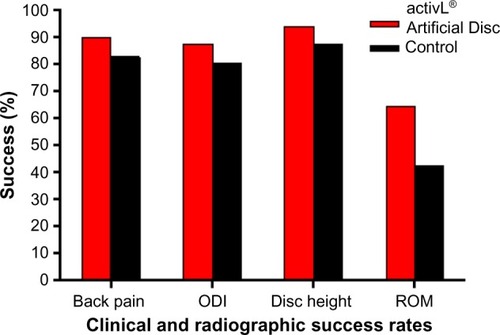
Figure 4 Time to return to work in a randomized controlled trial comparing activL® Artificial Disc to control total disc replacements (ProDisc-L or Charité).
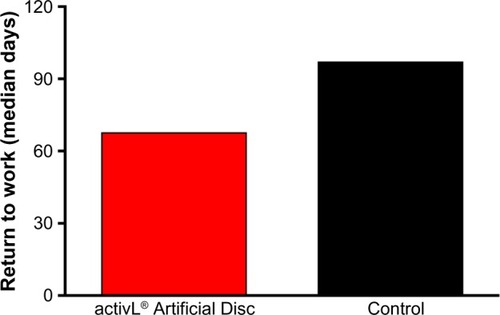
Figure 5 Incidence of complications in a randomized controlled trial comparing activL® Artificial Disc to control total disc replacements (ProDisc-L or Charité).
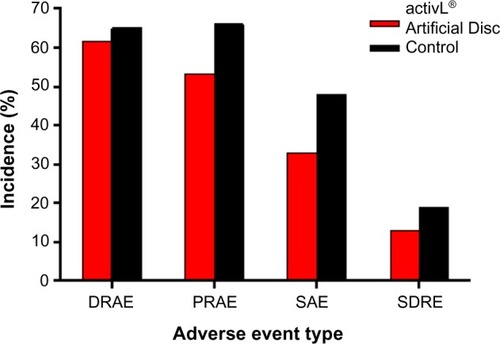
Figure 6 Changes in back pain severity over 6-year mean follow-up with activL® Artificial Disc versus ProDisc-L.
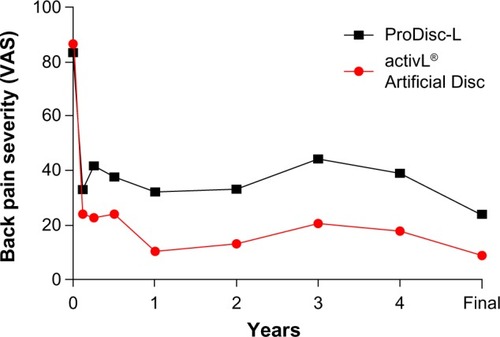
Figure 7 Changes in Oswestry Disability Index over 6-year mean follow-up with activL® Artificial Disc versus ProDisc-L.
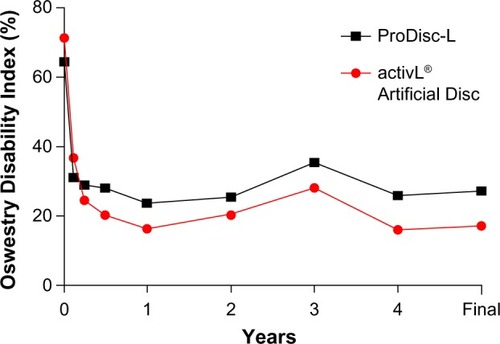
Figure 8 Anterioposterior (left) and lateral (right) radiographs 7 years following implant with the activL® Artificial Disc.
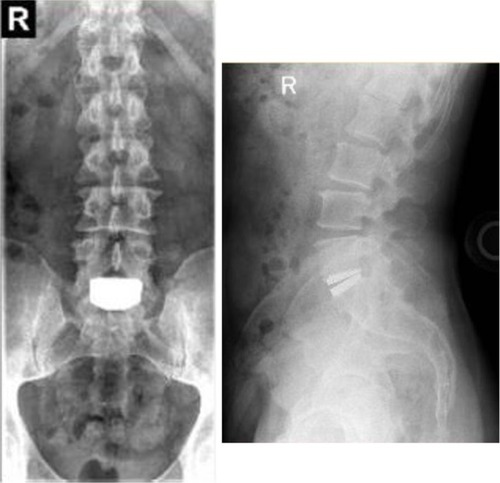
Figure 9 Comparison of 2-year back pain severity with activL® Artificial Disc versus randomized controlled trial outcomes of lumbar total disc replacement (TDR) or fusion.
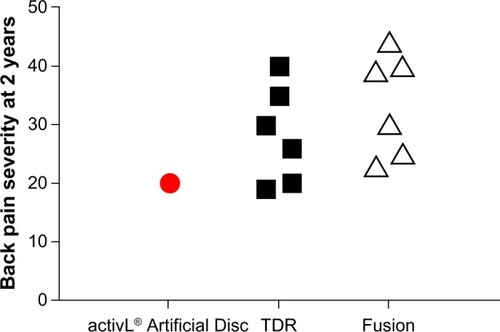
Figure 10 Comparison of 2-year Oswestry Disability Index (ODI) with activL® Artificial Disc versus randomized controlled trial outcomes of lumbar total disc replacement (TDR) or fusion.
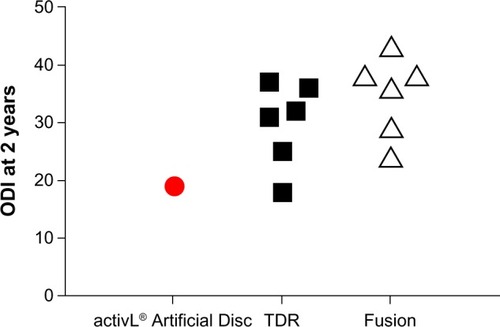
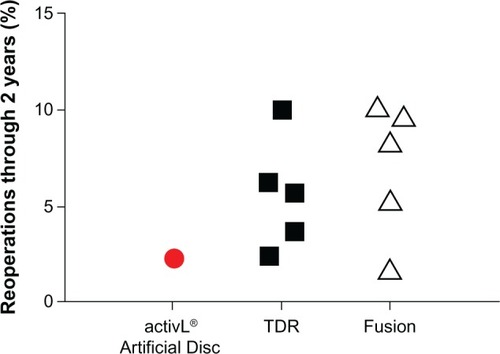
Figure 11 Comparison of 2-year reoperation rates with activL® Artificial Disc versus randomized controlled trial outcomes of lumbar total disc replacement (TDR) or fusion.