Figures & data
Table 1 MEDLINE search strategy
Figure 1 PRISMA flow diagram.
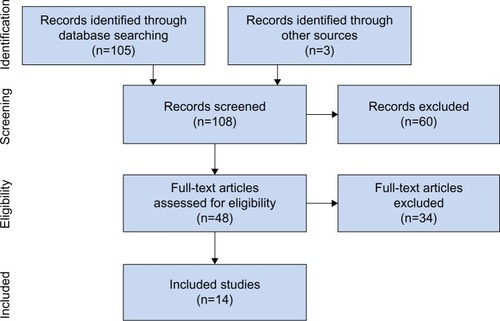
Table 2 Baseline patient characteristics
Table 3 Powered exoskeleton training protocols
Figure 2 Ability to ambulate using a powered exoskeleton without physical assistance.
Abbreviation: CI, confidence interval.
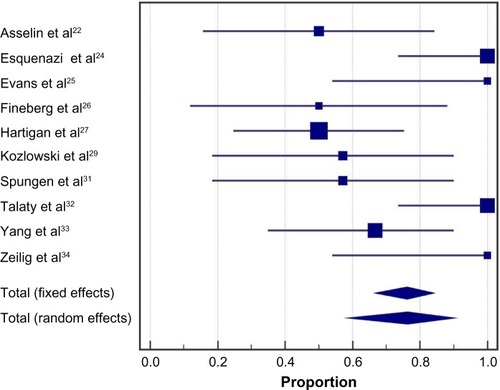
Figure 3 Outcomes of randomized controlled trial comparing powered exoskeleton, reciprocating gait orthosis, and hip-knee-ankle-foot orthosis.
Notes: A is PCI, B is 6-min walk distance, and C is walking velocity. *Exoskeleton outcomes superior to RGO and HKAFO for walking velocity (both P<0.001), 6-minute walk distance (P=0.03 vs RGO; P<0.01 vs HKAFO), and PCI (both P<0.001).
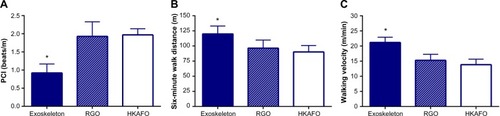
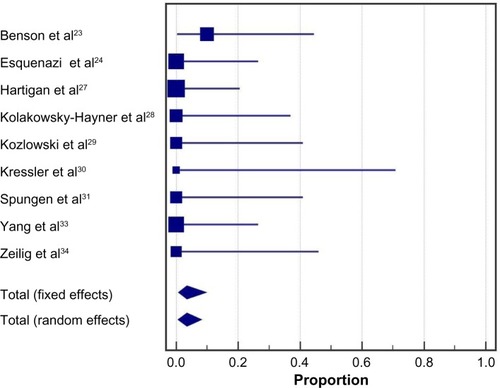
Figure 4 Six-minute walk test results with a powered exoskeleton.
Abbreviation: CI, confidence interval.
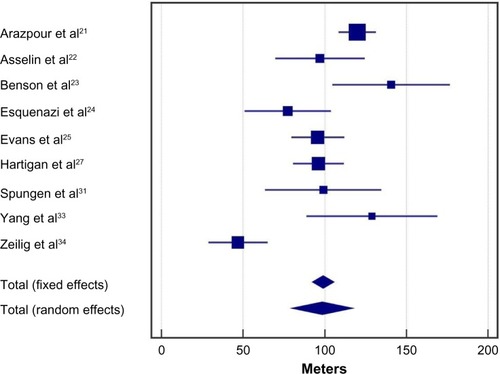
Figure 5 Metabolic equivalents with powered exoskeleton walking.
Abbreviation: CI, confidence interval.
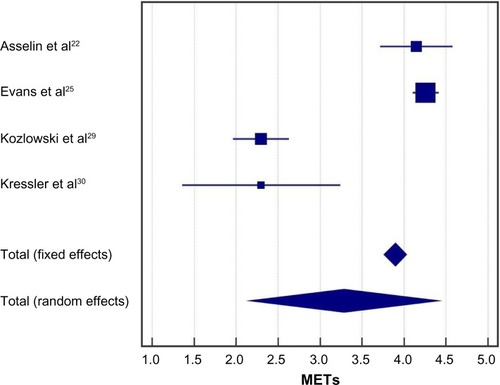
Figure 6 Rating of perceived exertion with powered exoskeleton walking.
Abbreviations: CI, confidence interval; RPE, rating of perceived exertion.
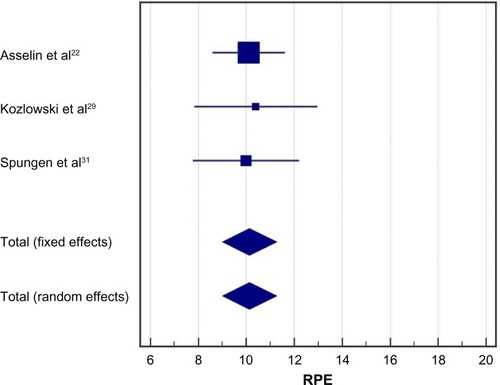
Figure 7 Spasticity decreases with powered exoskeleton training.
Abbreviation: CI, confidence interval.
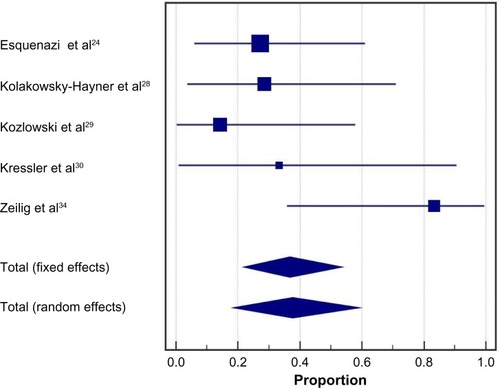
Figure 8 Improvements in bowel movement regularity with powered exoskeleton training.
Abbreviation: CI, confidence interval.
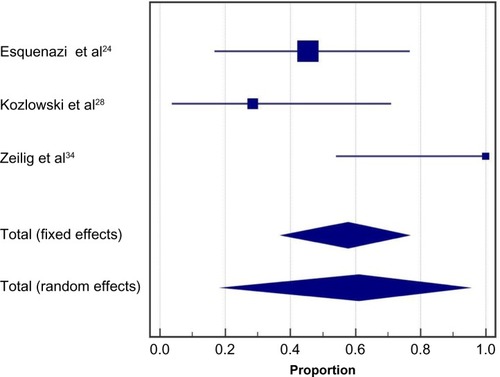
Figure 9 Incidence of falls with a powered exoskeleton.
Abbreviation: CI, confidence interval.
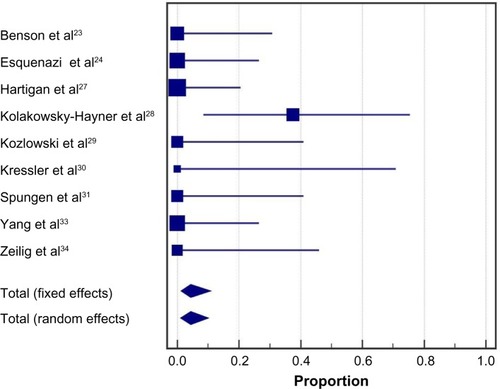
Figure 10 Incidence of fractures with a powered exoskeleton.
Abbreviation: CI, confidence interval.