Figures & data
Figure 1 The UnoPen™ disposable pen injector.
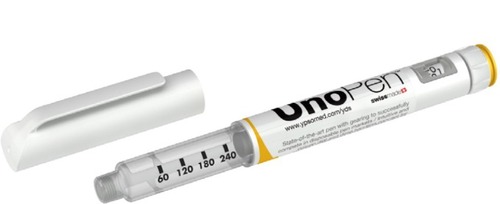
Figure 2 Theoretical relationship between CoF at the dose sleeve/threaded sleeve interface and dimensionless overall pen injector force transmission efficiency.
Abbreviation: CoF, coefficient of friction.
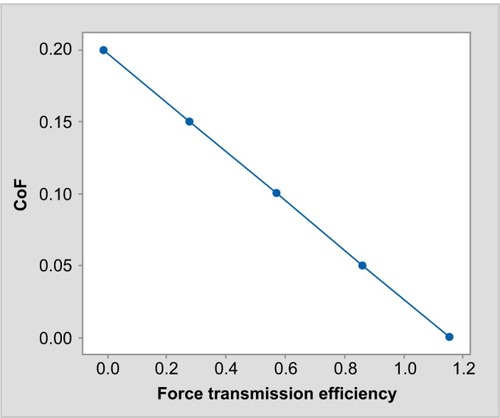
Figure 3 Threaded sleeve (A) and dose sleeve (B) parts.
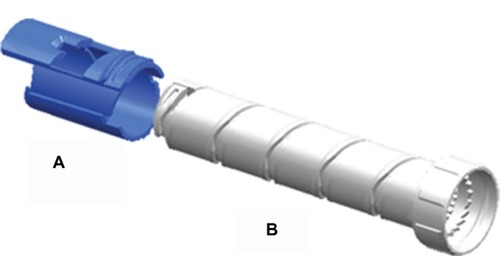
Table 1 Polymers and lubricants
Table 2 Combinations of materials tested
Figure 4 An experimental test set-up for the measurement of CoF.
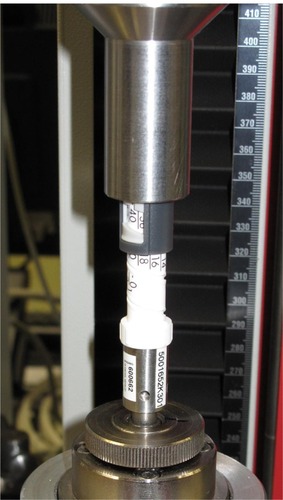
Figure 5 Two-dimensional model of the interface between the threaded sleeve and dose sleeve parts.
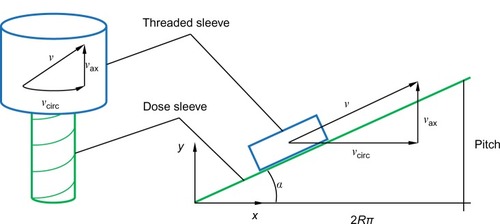
Figure 6 Force equilibrium under constant velocity movement of the threaded sleeve.
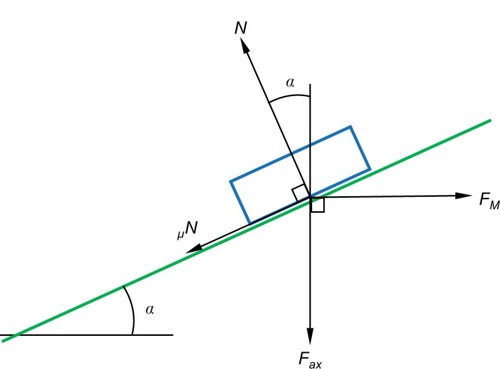
Figure 7 CoF measured for combination 1.
Abbreviation: CoF, coefficient of friction.
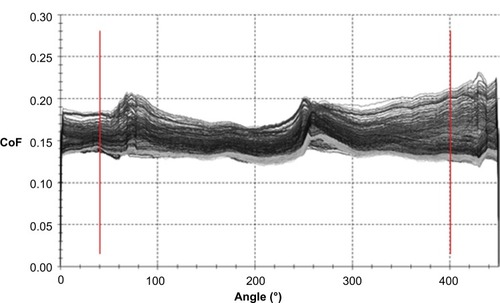
Figure 8 Evolution of kinetic CoF over repeat cycles (combinations 1–3, different polymers).
Abbreviations: CoF, coefficient of friction; POM, polyoxymethylene; PBT, polybutylene terephthalate; PC, polycarbonate; PA, polyamide; no, number.
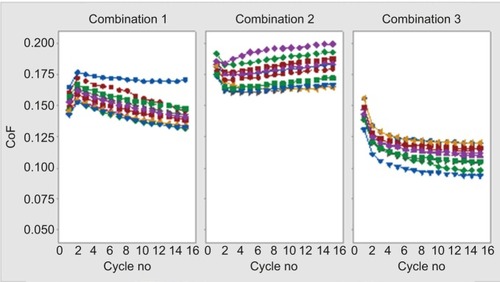
Figure 9 Evolution of kinetic CoF over repeat cycles (combinations 4–7, internal lubrication).
Abbreviations: CoF, coefficient of friction; PTFE, polytetrafluoroethylene; no, number.
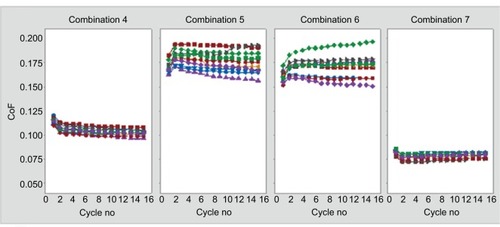
Figure 10 Evolution of kinetic CoF over repeat cycles (combinations 8–11, external lubrication).
Abbreviations: CoF, coefficient of friction; PTFE, polytetrafluoroethylene; no, number.
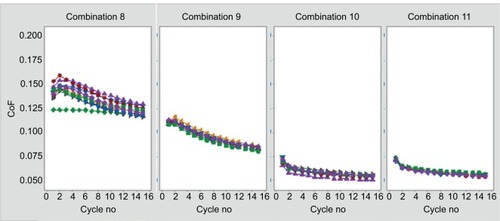
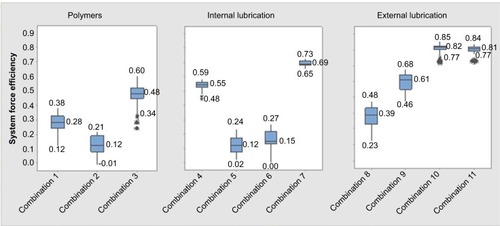
Figure 11 Dimensionless system efficiency calculated from the measured kinetic CoF for all combinations.
Abbreviations: CoF, coefficient of friction; POM, polyoxymethylene; PBT, polybutylene terephthalate; PC, polycarbonate; PA, polyamide; PTFE, polytetrafluoroethylene.