Figures & data
Figure 1 (A) The location of the Sebutape on the bridge of the nose pre- and post-mask applications. (B) Graduated marks (white vertical lines) placed on the straps of the mask to incrementally increase the strap tension. (C) Location of Talley pressure monitoring cells on the nose and cheeks.
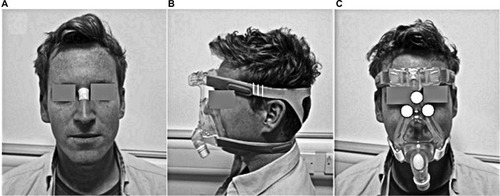
Table 1 Summary of outcome measure data from M1 and M2 across three strap tensions
Figure 2 Box and whisper plots of the IL-1α cytokine ratios from pre- to post-mask application. Note: *P-value =0.04.
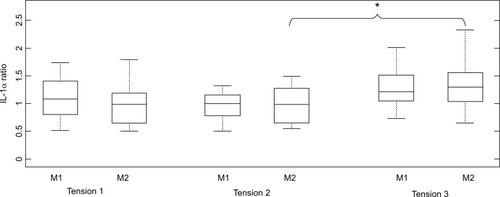
Figure 3 (A) IL-8 cytokine concentrations for participant P2 during M1 application. (B) IL-1α cytokine concentrations for participant P12 during M2 application. (C) IL-2 cytokine concentrations for participant P4 during M1 application.
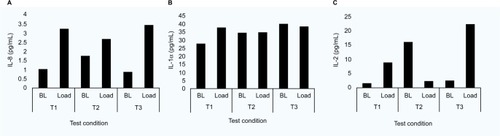
Table 2 Summary of ratio changes in the cytokines pre- to post-mask application
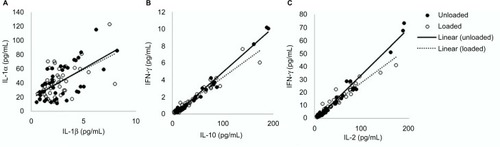
Figure 4 Relationship between cytokine groups: (A) IL-1 family, IL-1α and IL-1β; (B) IL type II family, IFN-γ and IL-10 and (C) γ family, IL-2 and IFN-γ.