
Figures & data
Figure 1 The PPG-based SBP measurement apparatus includes a pressure cuff wrapped around the arm and two photoplethysmographic probes on the fingers of the two hands.
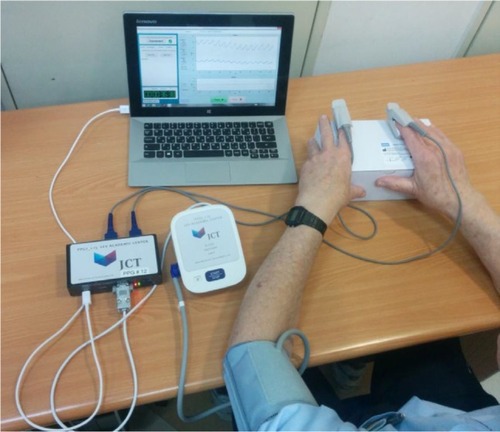
Figure 2 (A) The PPG probe. Light is transmitted from the light-source (LED) through the fingertip to the photodetector (PD). (B) Some pulses of the original PPG signal: the changes in transmitted light intensity as a function of time, due to cardiac activity. Maximal transmitted light intensity occurs at end diastole, when the tissue blood volume is at a minimum. Vp is the voltage pulses measured by the photodetector PD.
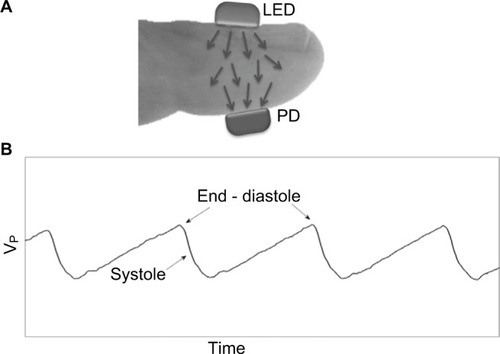
Figure 3 The PPG pulses (VP) in the two hands of one of the subjects during cuff deflation for cuff pressures PC in the neighborhood of the SBP value. The lower PPG curve is in the hand distal to the cuff and the upper one in the cuff-free hand. The vertical dotted lines indicate the start time of the systolic decrease in the cuff-free hand PPG pulses. The star indicates the time of the first detection of the Korotkoff sounds and the arrow indicates the start of the corresponding PPG pulse. In this examination, the first Korotkoff sounds were heard at nearly the same heart beat at which the first PPG pulse was detected. From Nitzan M, Adar Y, Hoffman E, et al. Comparison of systolic blood pressure values obtained by photoplethysmography and by Korotkoff sounds. Sensors (Basel). 2013;13(11):14797–14812.Citation37
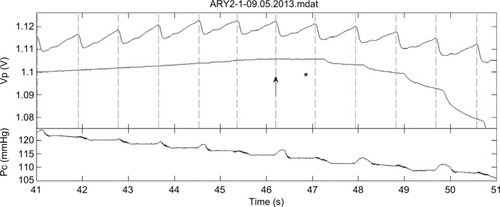
Table 1 Results of mean difference, SD, and correlation coefficient of SBP measurement with the PPG-based technique and oscillometry as compared with those of auscultatory sphygmomanometry