Figures & data
Figure 1 Conceptual measurement system.
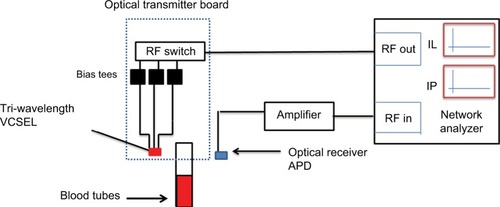
Figure 2 Transmission mode optical measurements through blood tubes.
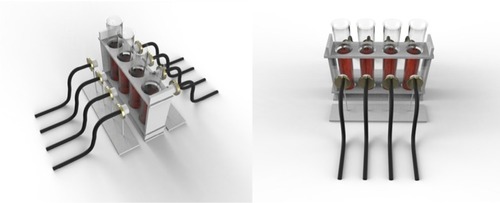
Figure 3 Broadband transmission mode (through blood tubes) result of insertion loss (IL).
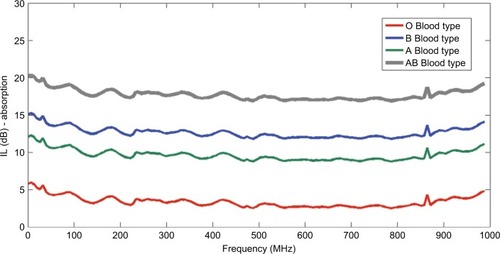
Figure 4 Broadband transmission mode (through blood tubes) result of insertion phase (IP).
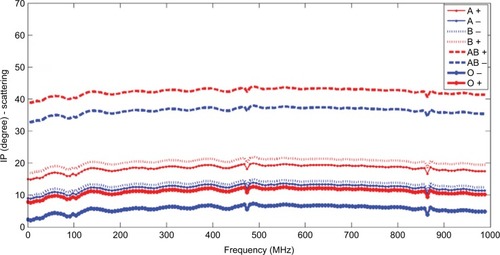
Table 1 Transmission mode index result of IL and IP mapped to different blood types
Figure 5 Reflection mode optical measurements through lower forearm hand.
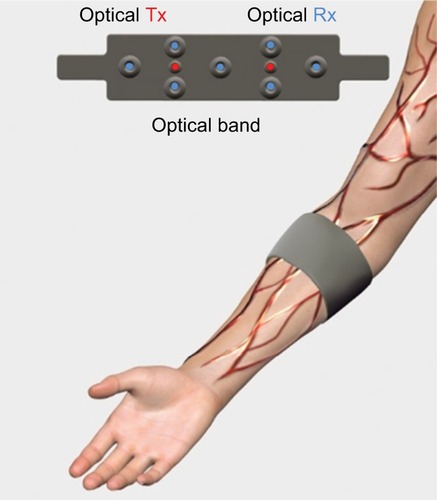
Figure 6 Signal processing procedure to identify the change in slope and frequency stamp associated with it.
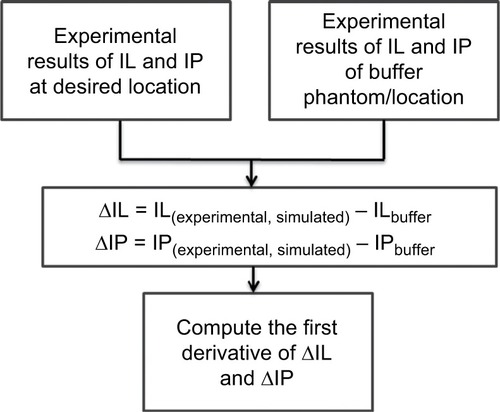
Figure 7 Averaged insertion loss (IL) measurements for reflection mode lower forearm.
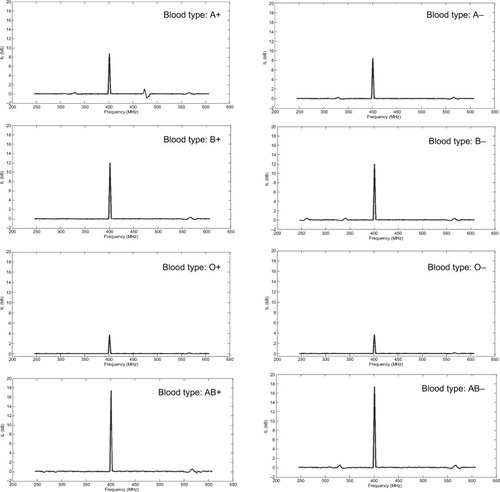
Figure 8 Averaged insertion phase (IP) measurements for reflection mode lower forearm.
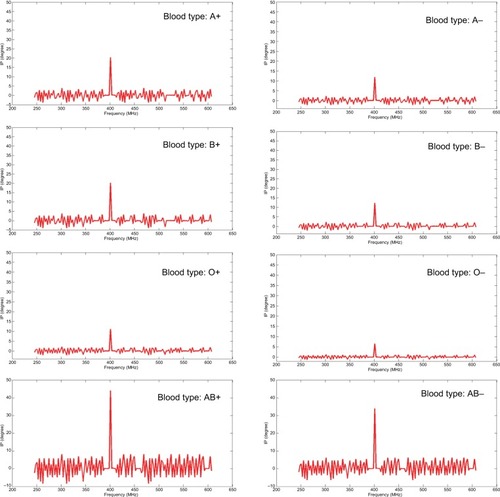
Table 2 Peaked averaged result of ∆IL and ∆IP for reflection mode lower forearm
Figure 9 Correlation analysis between stage 1 and stage 2 (index result for the noninvasive lower forearm measurements).
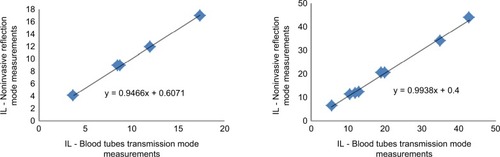
Table 3 False-negative (FN) percentage error performed on 480 patients (60 patients from each blood type)
Figure 10 False negatives (FNs) for 480 human subjects tested to predict human blood type using noninvasive optical device.
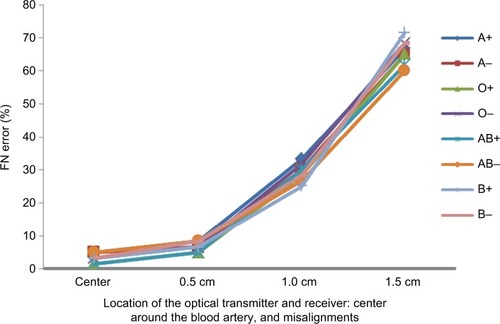
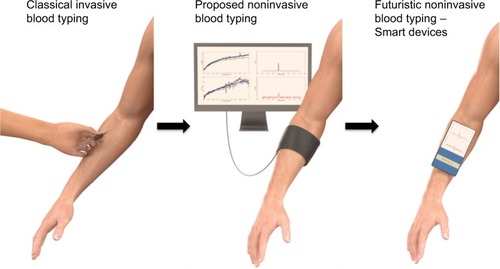
Figure 11 Optical biosensor past, present, and futuristic development for noninvasive blood typing.