Figures & data
Figure 1 Phantom container system.
Notes: A simulation was constructed using materials to mimic the biological structure and sounds reproduced by an organic chest cavity. Layers of foam were used to support and stabilize the transducer. The castor oil used shared similar sound wave propagation properties just like the human body.
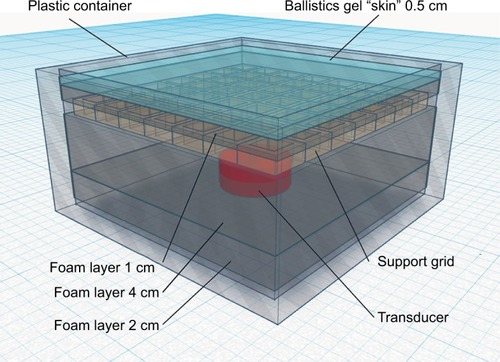
Figure 2 Experimental setup.
Note: To minimize frequency interference, a shock-absorbing structure suspended the phantom container using wide elastic bands.
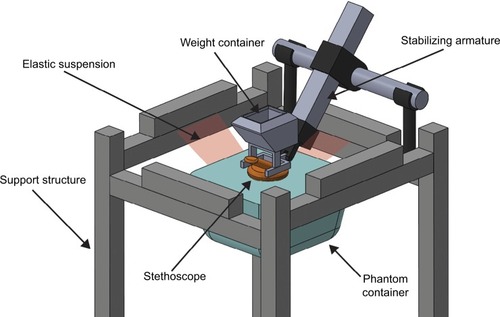
Table 1 Stethoscope models evaluated
Figure 3 Frequency responses for each stethoscope.
Note: The phantom is capable of transmitting the full range of audible frequencies.
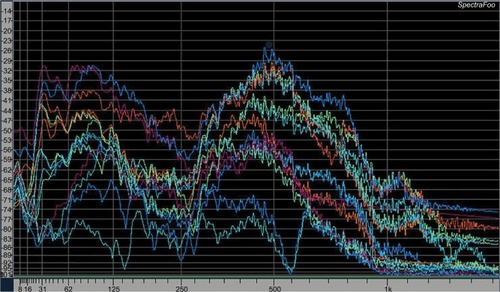
Table 2 Clinically relevant frequency ranges
Figure 4 AMB rejection.
Note: The spectrogram depicts pink noise signals auscultated (left column) using a Thinklabs stethoscope and the AMB detected (right column) by microphones attached to both binaurals.
Abbreviations: AMB, ambient noise; L, left; R, right.
Abbreviations: AMB, ambient noise; L, left; R, right.
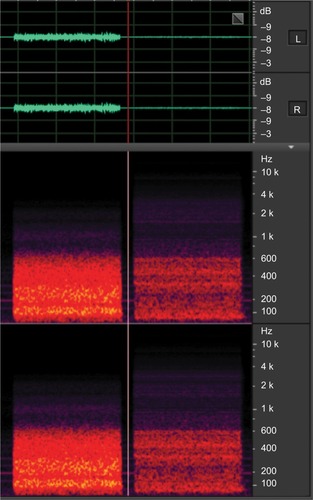
Figure 5 Sensitivity to GI sounds.
Note: The perceived loudness of acoustic stethoscopes (left) and electronic stethoscopes (right) to frequency range 97–1,034 Hz was measured to compare their sensitivity to general GI sounds.
Abbreviations: GI, gastrointestinal; LUFS, Loudness Units relative to digital Full Scale.
Abbreviations: GI, gastrointestinal; LUFS, Loudness Units relative to digital Full Scale.
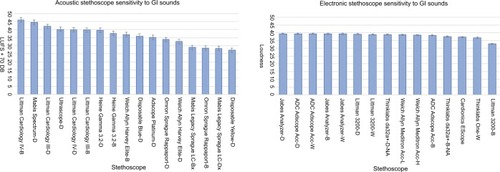
Figure 6 Noise rejection of GI sounds.
Note: Noise rejection of GI sounds. Acoustic (left) and electronic (right) stethoscope noise rejection was measured at frequency ranges (97–1,034 Hz) of GI sounds.
Abbreviations: GI, gastrointestinal; LUFS, Loudness Units relative to digital Full Scale.
Abbreviations: GI, gastrointestinal; LUFS, Loudness Units relative to digital Full Scale.
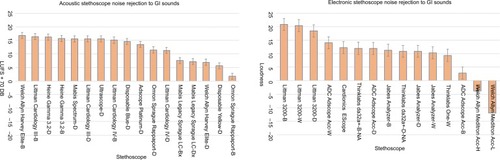
Figure 7 Sensitivity to cardiac sounds 22–281 Hz.
Note: The perceived loudness of acoustic stethoscopes (left) and electronic stethoscopes (right) to frequency range 22–281 Hz was measured to compare their sensitivity to cardiac sounds.
Abbreviation: LUFS, Loudness Units relative to digital Full Scale.
Abbreviation: LUFS, Loudness Units relative to digital Full Scale.
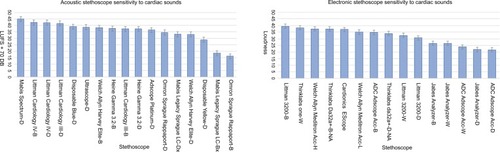
Figure 8 Noise rejection of cardiac sounds 22–281 Hz.
Note: Acoustic (left) and electronic (right) stethoscope noise rejection was measured at frequency ranges (22–281 Hz) of cardiac sounds such as S1–S4, innocent murmurs, and MS.
Abbreviations: LUFS, Loudness Units relative to digital Full Scale; MS, mitral stenosis.
Abbreviations: LUFS, Loudness Units relative to digital Full Scale; MS, mitral stenosis.
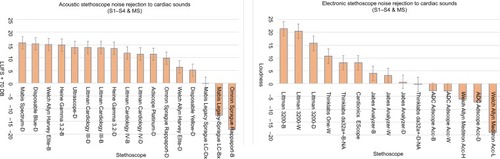
Figure 9 Sensitivity to cardiac murmur sounds 205–775 Hz.
Note: The perceived loudness of acoustic (left) and electronic stethoscopes (right) to frequency range 205–775 Hz was measured to compare their sensitivity to cardiac murmur sounds.
Abbreviation: LUFS, Loudness Units relative to digital Full Scale.
Abbreviation: LUFS, Loudness Units relative to digital Full Scale.
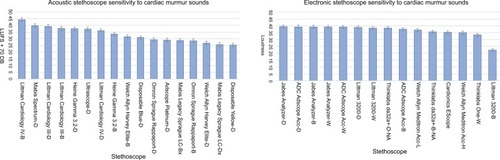
Figure 10 Noise rejection of cardiac sounds 205–775 Hz.
Note: Acoustic (left) and electronic (right) stethoscope noise rejection was measured at frequency ranges (205–775 Hz) of cardiac sounds such as VSD, ASD, AS, and PS.
Abbreviations: AS, aortic stenosis; ASD, atrial septal defect; LUFS, Loudness Units relative to digital Full Scale; PS, pulmonic stenosis; VSD, ventricular septal defect.
Abbreviations: AS, aortic stenosis; ASD, atrial septal defect; LUFS, Loudness Units relative to digital Full Scale; PS, pulmonic stenosis; VSD, ventricular septal defect.
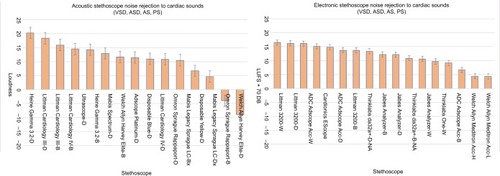
Figure 11 Sensitivity to respiratory sounds.
Note: The perceived loudness of acoustic (left) and electronic stethoscopes (right) to frequency range 689–2,584 Hz was measured to compare their sensitivity to respiratory sounds.
Abbreviation: LUFS, Loudness Units relative to digital Full Scale.
Abbreviation: LUFS, Loudness Units relative to digital Full Scale.
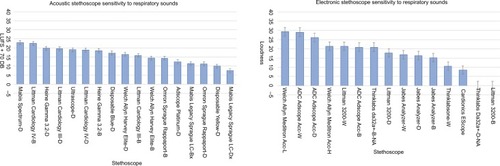
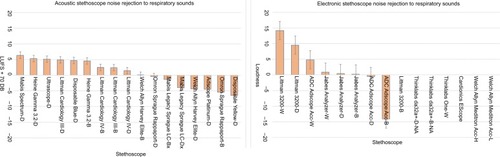
Figure 12 Noise rejection of respiratory sounds.
Note: Acoustic (left) and electronic (right) stethoscope noise rejection was measured at frequency ranges (689–2,584 Hz) of respiratory sounds.
Abbreviation: LUFS, Loudness Units relative to digital Full Scale.
Abbreviation: LUFS, Loudness Units relative to digital Full Scale.