
Figures & data
Figure 1 Summary of the STAR protocol. Grey blocks refer to actions taken at patient bedside.
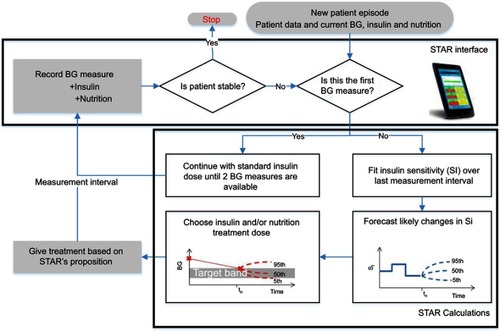
Figure 2 Summary of the cohort data and its selection for analysis.
Abbreviations: STAR, Stochastic TARgeted.
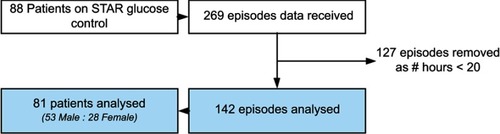
Figure 3 Per-patient boxplots of BG measurements.
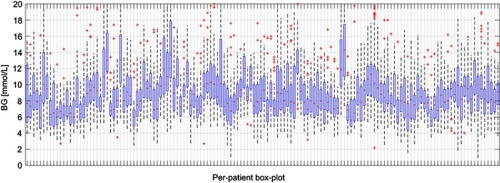
Table 1 Cohort and per-patient glycemic control results
Figure 4 Episode 38a.
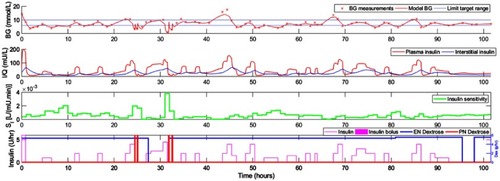
Figure 5 Per-episode BG CDFs defined on whole cohort.
Abbreviations: BG, blood glucose; CDFs, cumulative distributive functions.
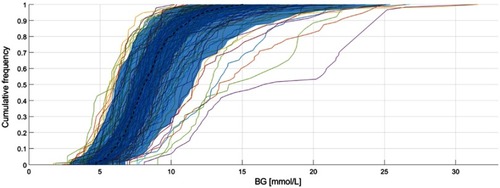
Table 2 1–3 hourly treatment chosen for each episode
Figure 6 Histogram for starting blood glucose level.
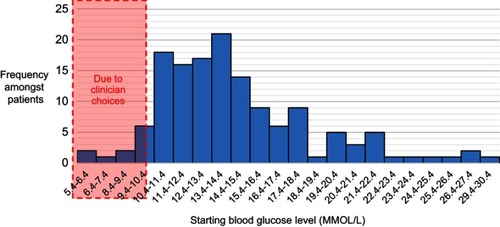
Figure 7 Percentage of insulin rate given over overall administration.
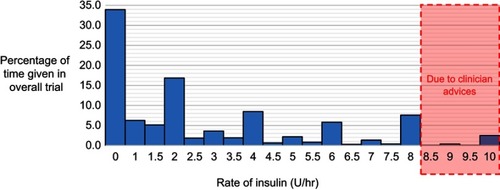
Table 3 Per-episode hourly interpolated glycemic control results for the three STAR cohorts in IIUMMC, Christchurch and Gyulá Hospital ICUs
Figure S1 Per-episode insulin sensitivity (SI) profiles for the pilot trial cohort.
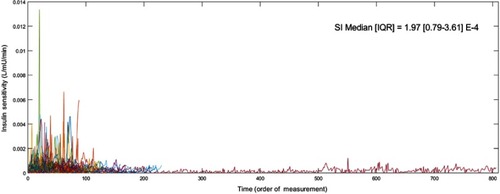
Table S1 Patient details for 5 episodes with severe hypoglycemia. Selected clinical results with potential diagnosis