
Figures & data
Figure 1 PCDs selected for laboratory testing.
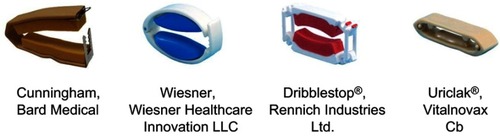
Table 1 Laboratory testing timeline for measurements
Figure 2 Location of the three measurements to assess the skin response on the penis when subjected to each of the penile compression devices (PCD) applied at their associated prescribed interface pressures.
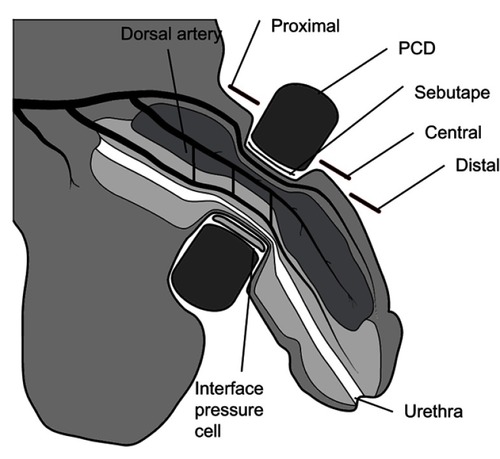
Figure 3 Temporal profiles of mean interface pressure values ± SD for six participants and each of the penile compression devices (PCDs) over the 50 mins wear period.
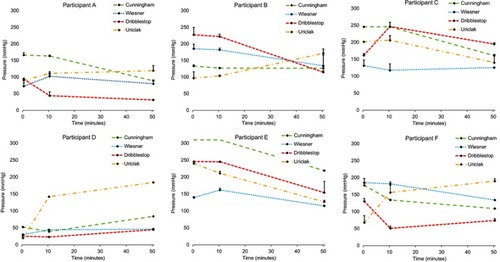
Figure 4 Temporal profiles of Doppler ROI values in three regions of the penis of two participants for each of the penile compression device (PCD) designs. Error bars represent perfusion flux SD.
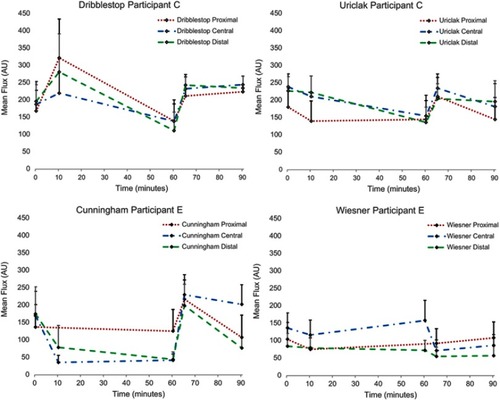
Figure 5 The Dribblestop penile compression device (PCD) had, by 60 mins wear time, decreased distal blood perfusion flux () after an initial rise corresponding to a sustained increase in interfacial pressure (). (A) Scanned image (B) PCD location superimposed over flux scan.
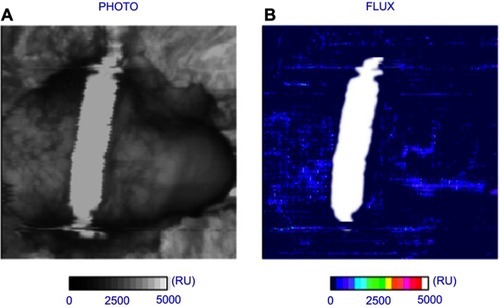
Figure 6 Inflammatory response (IL-1α [pg/mL]) measured at the skin surface over the 90 mins test period.
![Figure 6 Inflammatory response (IL-1α [pg/mL]) measured at the skin surface over the 90 mins test period.](/cms/asset/c8566708-8ab7-466f-80fa-3e7070754b57/dmde_a_12171635_f0006_c.jpg)