
Figures & data
Figure 1 Consort chart.
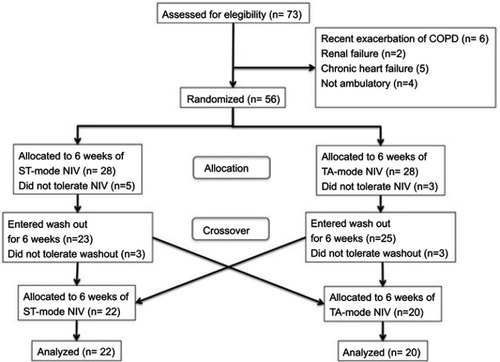
Table 1 Ventilator settings
Table 2 Patient diseases, BMI, walking distance and pulmonary function tests
Table 3 Patient diseases and daytime ABG
Figure 2 Mean CO2 values at night and during the day before and after 6 weeks of ST-mode and controlled NIV.Abbreviation: NIV, noninvasive ventilation.
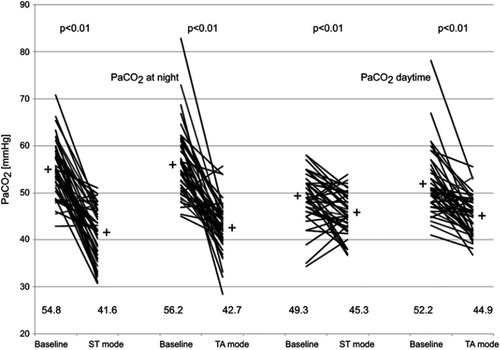
Figure 3 Mean HCO3 values at night and during the day before and after 6 weeks of ST-mode and controlled NIV.
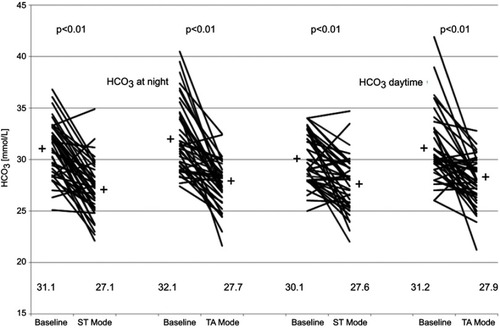
Figure 4 Mean CO2 values at night and during the day before and after 6 weeks of ST-mode and controlled NIV (COPD patients only).
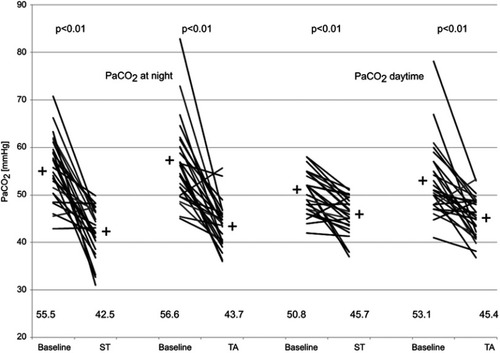
Figure 5 Mean HCO3 values at night and during the day before and after 6 weeks of ST-mode and controlled NIV (COPD patients only).Abbreviation: NIV, noninvasive ventilation.
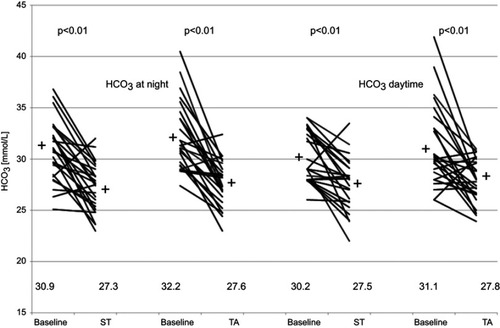
Table 4 Lung function parameters before and after treatment periods