
Figures & data
Figure 1 Manufacturer recommendations for sensor placement in infants, numbered in order of preference (1= high, 3= low). Source: SenTec AG, Therwil, Switzerland (www.sentec.com).
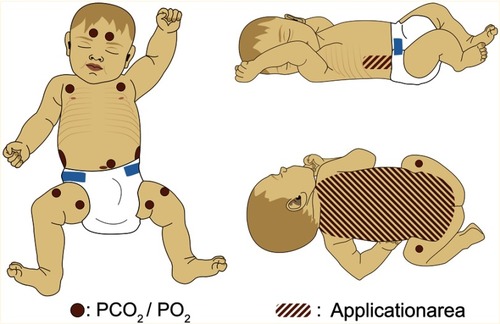
Table 1 Characteristics of NICU and non-NICU subjects. For continuous variables, values are mean±standard deviation
Table 2 Blood gas analysis (mean±standard deviation) for NICU and non-NICU subjects. Venous blood gas samples were taken at the end of the case
Figure 2 ΔEtCO2 and ΔTcPCO2 in NICU and non-NICU patients. Values are normalized to the measured PvCO2 for each patient, indicated by the zero line on the vertical axis. TcPCO2 rather than EtCO2 levels closely approximated PvCO2 in both populations. Dark bars: EtCO2; light bars: tcPCO2. Arrows indicate groups compared for independent-groups t-test. A nonparametric test for paired samples was also performed to compare measures of ΔEtCO2 and ΔTcPCO2 within each patient group. This test showed significant differences (P<0.05) between EtCO2 and tcPCO2 within both NICU and non-NICU patient groups.
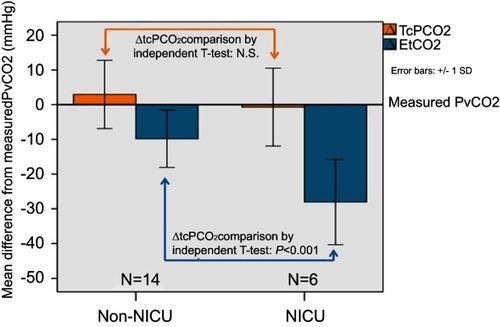
Figure 3 Bland–Altman plots showing mean difference (bias) for tcPCO2 (A) and EtCO2 (B) with 95% limits of agreement (red dashed lines). Blue dashed lines show the 95% confidence interval for the mean difference (bias). The bias is significant if the confidence interval does not include the line of equality (dashed line at zero). NICU patients, solid circles; non-NICU patients, open circles. Comparing tcPCO2 to PvCO2 (Figure 3A), these plots show good agreement between measures, with a mean difference (bias) of 1.86, in the full sample of 20 patients. The 95% confidence interval for the mean difference (blue dashed lines) includes zero, indicating lack of meaningful difference between tcPCO2 and PvCO2 measurements comparing EtCO2 to PvCO2 (B), the plots show a much higher bias of −15.29 for the full sample, with high variability, especially among NICU patients. Notably, in (B), the 95% confidence limits for the mean difference (blue dashed lines) do not include zero. This indicates that the mean bias in EtCO2 measurements is significantly different from zero (P<0.05) for the sample taken as a whole.
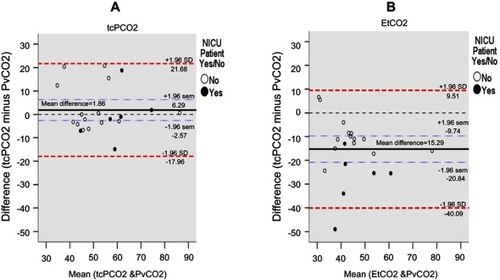
Table 3 Results of Bland–Altman analyses individually comparing tcPCO2 and EtCO2 to PvCO2. All measures were taken at the end of the surgery, as close as possible to the time of venous blood sampling. Values shown are bias (mean difference), the standard deviation (SD) of the bias, and 95% limits of agreement (mean±1.96*SD). Also shown is the standard error of the mean (sem), which is the basis for calculation of the confidence interval (CI) for the sampling error of the mean (mean±1.96*sem)