
Figures & data
Table 1 Textural features extracted from the dataset
Figure 1 Two-level classification approach using support vector machine (SVM).
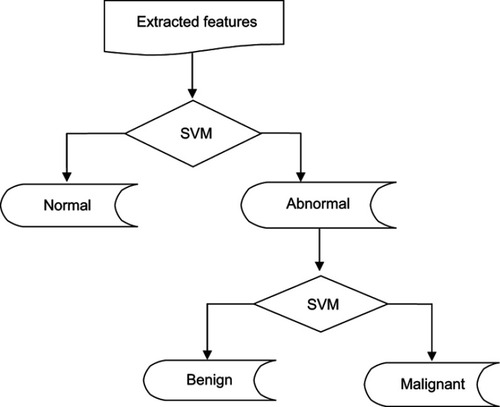
Figure 2 Mammogram enhancement using Contrast Limited Adaptive Histogram Equalization (CLAHE).
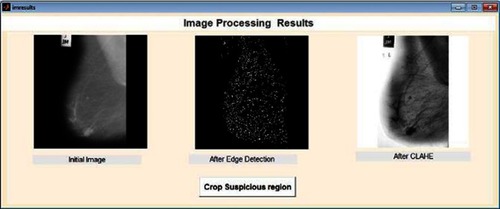
Figure 3 Region of interest (ROI) extraction.
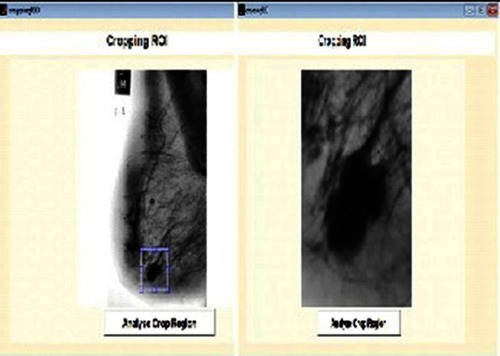
Figure 4 Gray level co-occurrence matrix (GLCM) features computed at D=1.
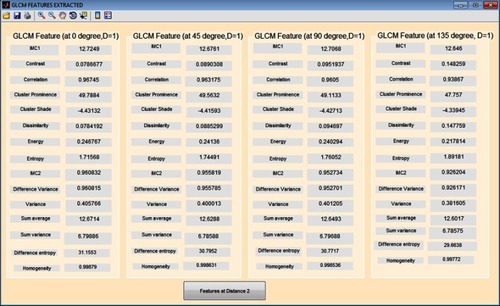
Figure 5 Gray level co-occurrence matrix (GLCM) features computed at D=2.
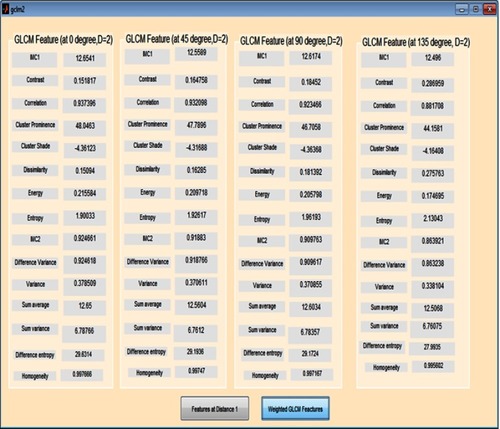
Figure 6 Weighted gray level co-occurrence matrix (GLCM) features computed at distances 1 and 2.
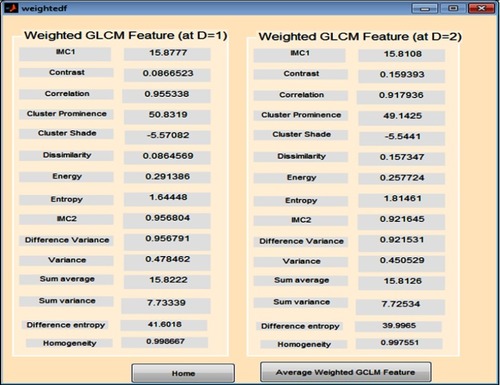
Figure 7 Overall average gray level co-occurrence matrix (GLCM) features computed.
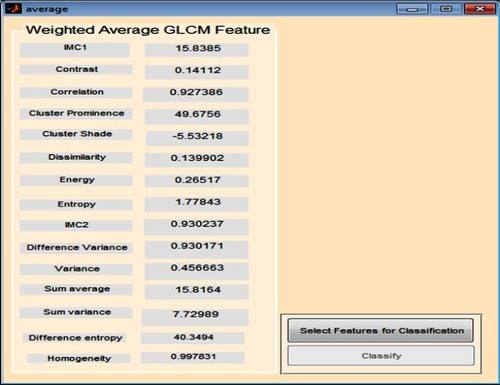
Figure 8 First-stage of classification: (A) normal mammogram classification; (B) abnormal mammogram classification.
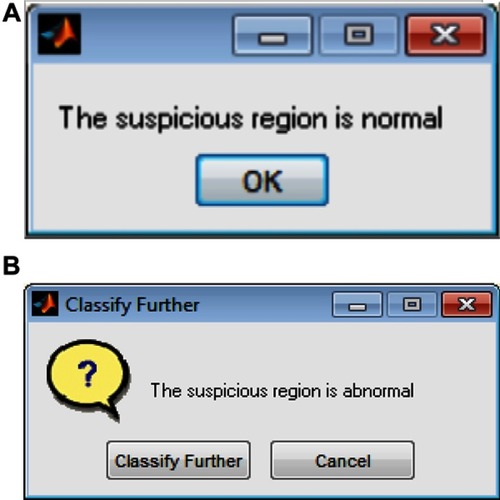
Figure 9 Second-stage classification: (A) benign; (B) malignant.
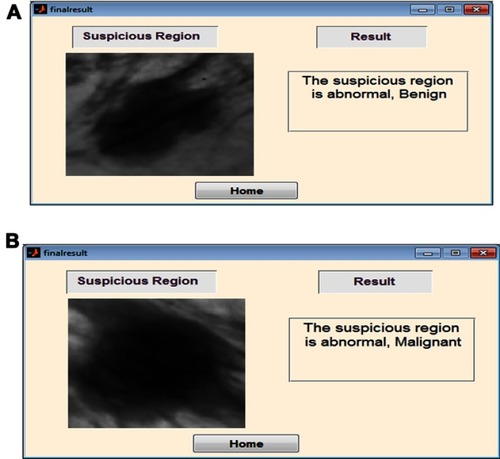
Table 2 The system’s confusion matrix
Table 3 Results from proposed technique and existing works
Data availability
Raw mammograms used in this work are publicly available at mini-MIAS: http://peipa.essex.ac.uk/pix/mias/.