Figures & data
Figure 1 The SinuSonic device. Depiction of the SinuSonic nasal device. The individual depicted here was not a research subject and provided written consent for this image to be published.
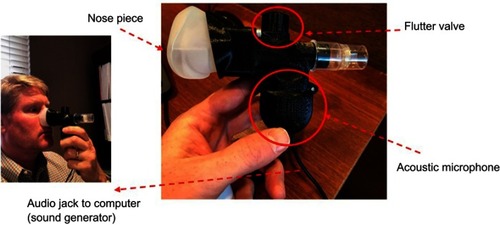
Table 1 Demographics
Figure 2 Visual analog scale for nasal congestion (A) and visual analog scale for ease-of-breathing (B). Self-assessment measure of subjective nasal congestion and ease-of-breathing. This measure was used before and after Sinusonic, and the difference score pre-post was tabulated to analyze symptom change.
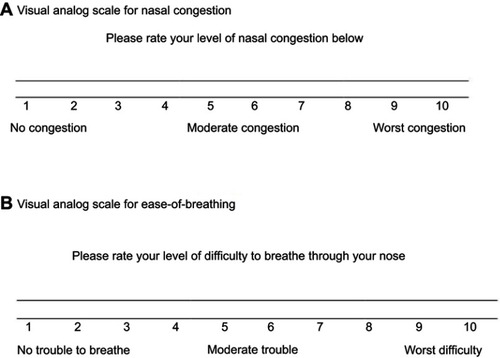
Figure 3 Improvement in self-reported breathing and congestion. X-axis represents the difference score between VAS scales pre- vs post-treatment. Wilcoxon signed-rank test revealed VAS post-test ranks were statistically improved over pre-test ranks (VAS congestion Z=3.1, p=0.002; VAS breathing Z=2.9, p=0.003).
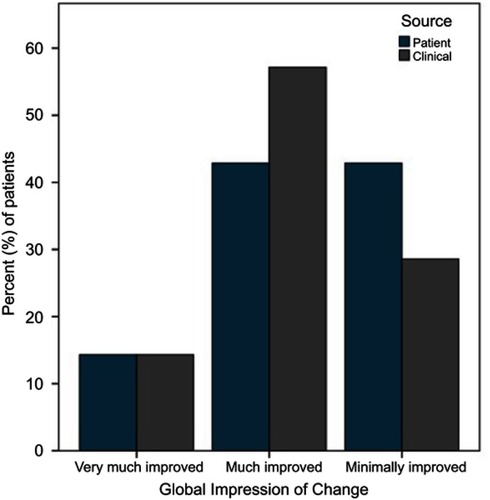
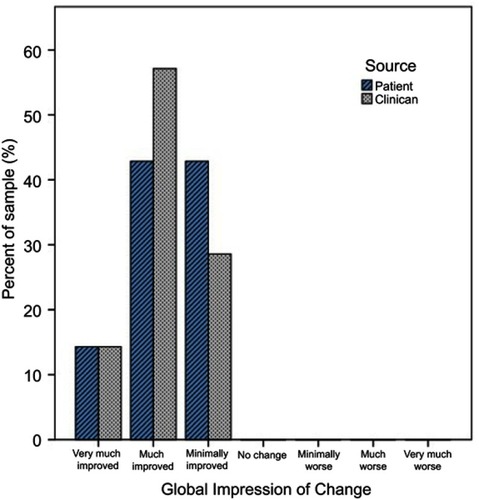
Figure 4 Clinical and patient global impressions of change. Binomial test – the proportion of patients with ≥ minimal improvement on CGI/PGI was higher than expected (100% vs expected 75% for both clinician and self-assessed, p=0.018).