Figures & data
Figure 1 Patient follow-up in LOIS study.
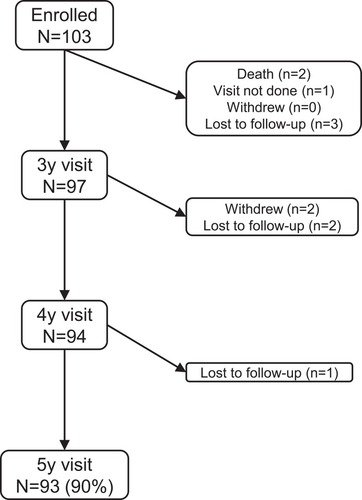
Table 1 Baseline And Surgical Characteristics Of Study Participants (n=103)
Figure 2 Improvement in SIJ pain (by visual analog scale, top), disability (Oswestry Disability Index, middle) and quality of life (EuroQOL-5D TTO index, bottom) over time.
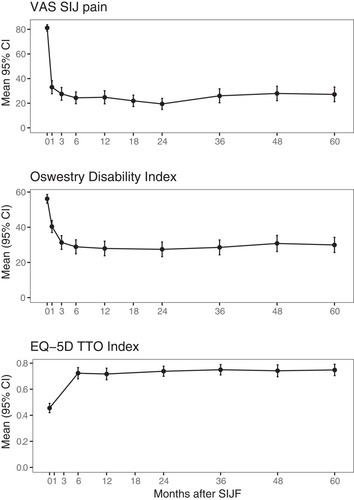
Figure 3 Left: satisfaction levels by study visit. Right: whether the subject would have the procedure again by study visit.
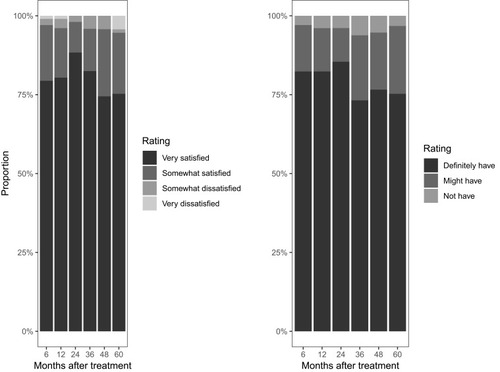
Figure 4 Proportion of subjects taking opioids by study visit.
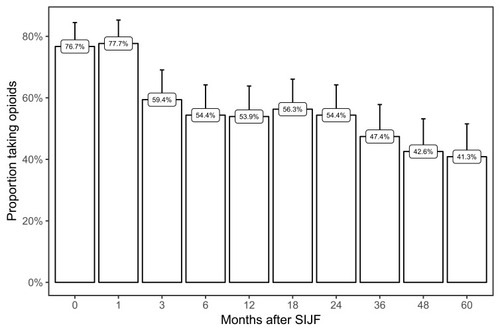
Figure 5 Work status by study visit.
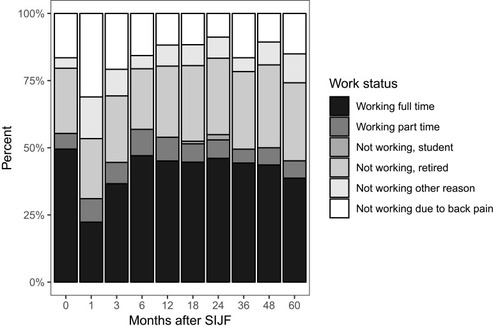
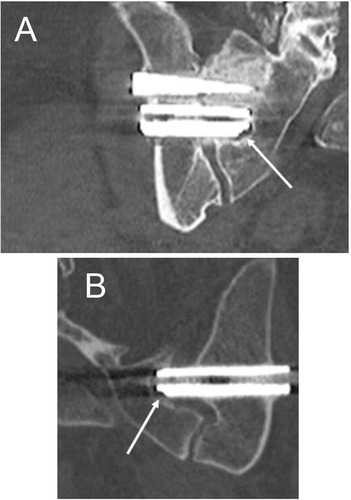
Figure 6 Sample radiographic outcomes. (A) Coronal CT image at 5 years of the right sacroiliac joint showing >30% bony apposition around all 3 implants and bridging bone adjacent to both the superior and middle implants (white arrows). (B) Axial CT image at 5 years of the right sacroiliac joint demonstrating positive bony remodeling (increased bone density) around the right-sided implants on both the sacral and iliac sides (white arrows).
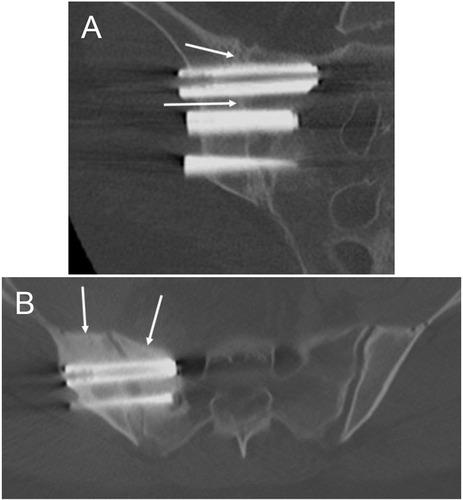
Figure 7 Coronal CT images at 5 years demonstrating radiolucency. (A) A small amount of radiolucency is present around the medial aspect of the middle implant (white arrow) in the right sacroiliac joint. (Note: third implant is out of plane, on a different slice.) Also noted is positive bony remodeling in the sacrum around the superior implant. (B) A second patient with radiolucency (white arrow) around the inferior implant at the left sacroiliac joint. Note the implant is short (i.e., not adequately engaged) in the sacrum.