
Figures & data
Figure 1 A schematic diagram of the setup used to study the aggregation and coagulation of blood.
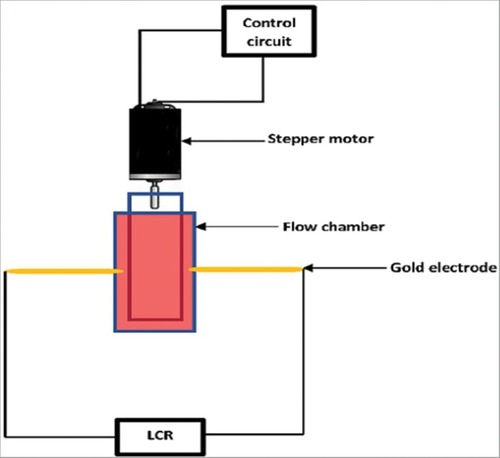
Figure 2 Time course of blood capacitance under different shear rates for control and diabetic blood.
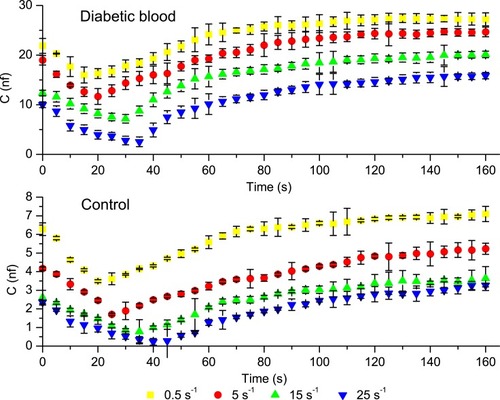
Table 1 The Minimum And Maximum C (nf) Values Under Different Shear Rates For Control And Type 2 Diabetes Blood Samples
Figure 3 Time course of blood impedance under different shear rates for control and diabetic blood samples.
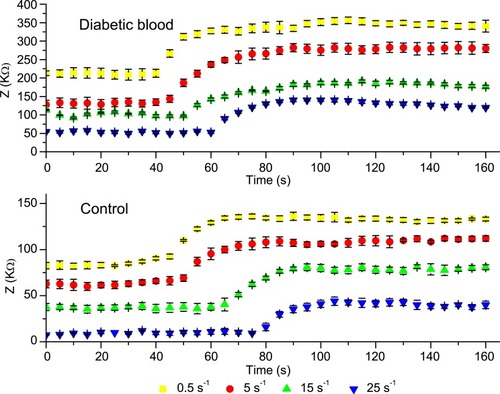
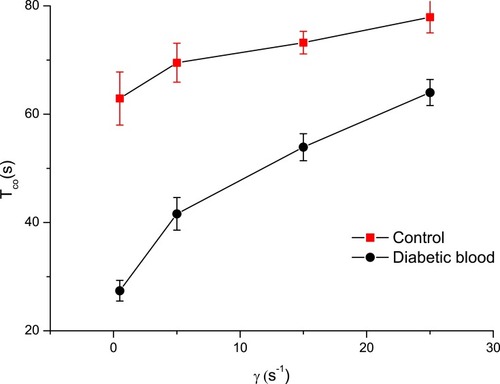
Figure 4 Correlation between aggregation half-time and shear rate (p<0.05).
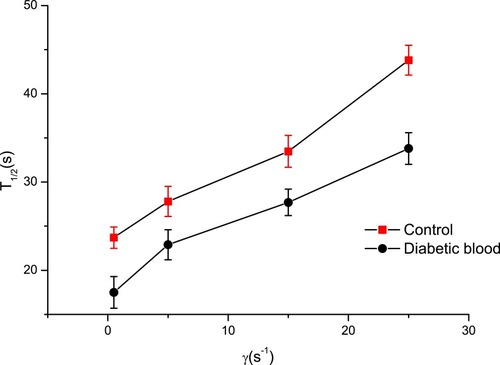
Figure 5 Correlation between aggregation index and shear rate (p<0.05).
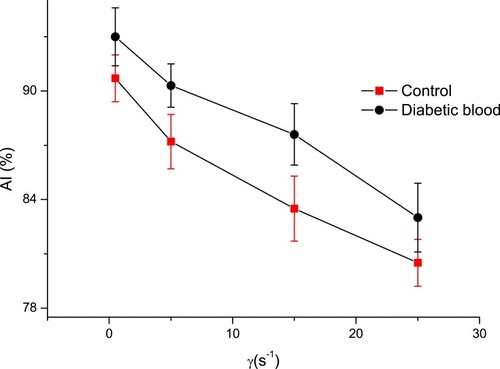
Figure 6 Correlation between blood coagulation time and shear rate (p<0.05).
Availability Of Data And Materials
The data supporting the findings of the study are included in this manuscript.