Figures & data
Figure 1 Images of two forms of pressure measurement used during study in the lateral decubitus position. (A) Water column manometer directly attached to needle via a 4-way stopcock and (B) The digital compass device attached directly to needle.
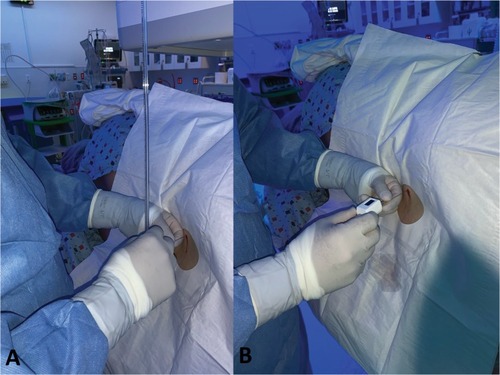
Table 1 Demographics And Indications For Referral For The Fluoroscopic LP Along With The Mean Opening Pressure Readings For Each Indication
Table 2 Mean Pressure Readings (cmH2O) And Time (In Seconds) To Obtain Pressure Reading For Digital Manometer And Water Column Manometer With P-Values
Figure 2 Linear regression of digital pressure readings of the two different devices with a line of identity (dashed line). (A) Comparison of pressure readings during opening pressure (r= 0.97) (B) Comparison of pressure readings during closing pressure (r=0.89).
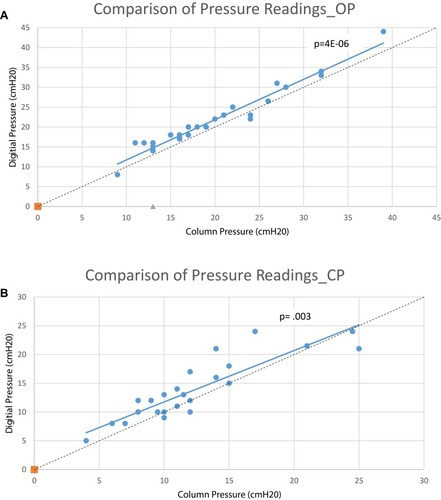
Figure 3 Bland–Altman plots showing the difference between the digital manometer reading and concurrent water column manometer reading during LP. The y-axis shows the mean difference of the two readings, with positive mean representing higher pressure by digital device and x-axis being the pressure reading in cmH2O (A) Plot for opening pressure with the mean difference (dashed line) positive indicating higher pressure for the digital device (B) Plot for closing pressures again with a positive mean difference indicating higher pressures with a wider confidence interval (solid line) compared to the opening pressures.
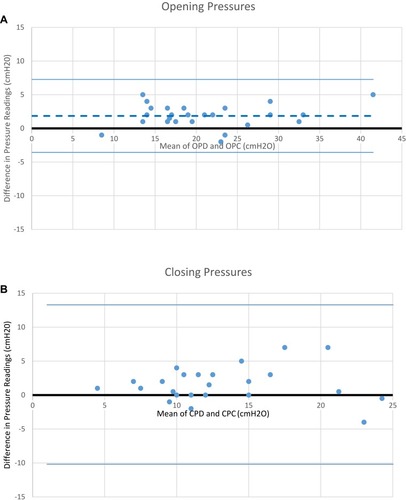
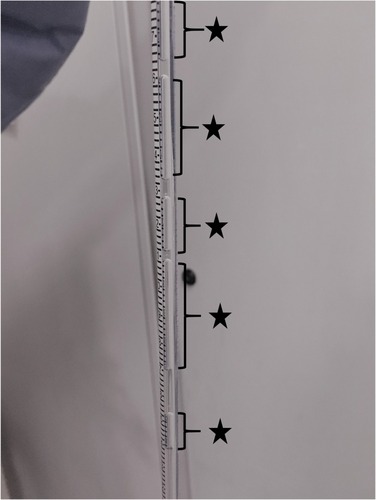
Figure 4 Example of air (stars) being entrapped in water column manometer during closing pressure making pressure reading difficult.