
Figures & data
Table 1 Patient’s Demographic
Table 2 Results of Compliance and Clinical Trials of IIUMMC Patients
Figure 1 BG cumulative distribution frequency (CDF) for (A) Overall (B) 2017 (C) 2018 and (D) 2019*.
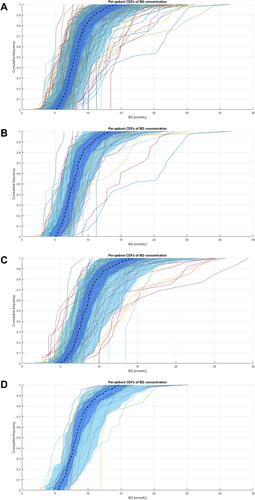
Figure 2 Profile figures of (A) compliant episode (patient 68), and (B) non-compliant episode (Patient 8) under STAR protocol. The first panel represents blood glucose (BG) mmol/L. The cross (x) is the BG clinical reading and the line is fitted BG using integral fitting method. The dashed line represents the BG limit target of 6–10.0 mmol/L (108–180 mg/dL). The second panel shows the plasma insulin (I) mU/L (dashed line) and interstitial insulin (Q) mU/L (straight line). The third panel is patient’s insulin sensitivity and the last panel represents insulin administered and feed given, straight line for insulin (U/hr), dashed line for Enteral feed (g/hr), and dashed dotted line for Parenteral feed (g/hr).
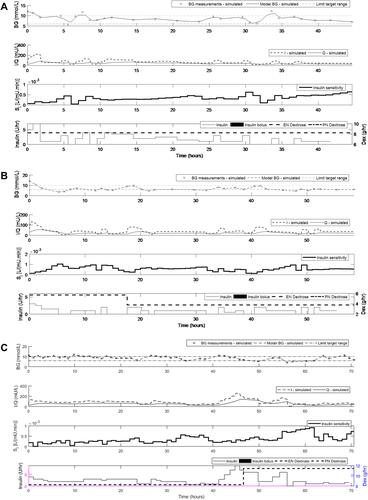
Figure 3 Non-compliance nutrition amount (mL) per episode for each year. It is clear non-compliance occurs primarily in 2017–18 .
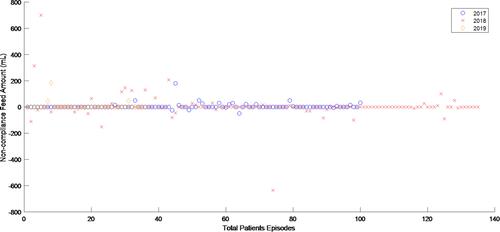
Figure 4 Non-compliance in total recommended insulin amount (U) per episode for each year. It is clear non-compliance occurs primarily in 2017 .
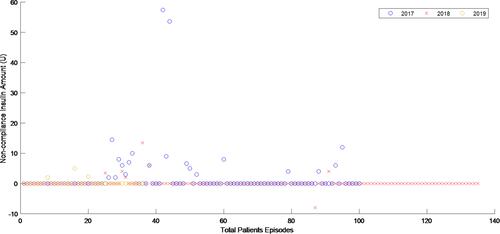
Table 3 The Availability and Number of Times 1-, 2-, and 3-Hour Interval Interventions Chosen