Figures & data
Figure 1 Scheme of the in vitro experimental design.
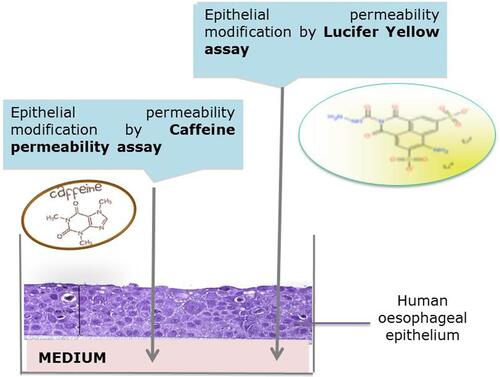
Figure 2 Morphological structure of human 3D reconstructed oesophageal epithelium (A) and its similarity with the biopsy of human full-thickness oesophageal mucosa (B).
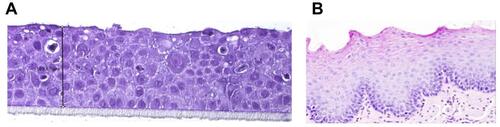
Table 1 Test Item Characterization
Figure 3 Caffeine penetration protocol.
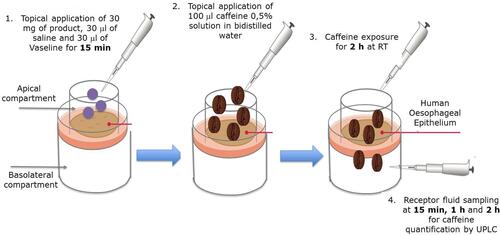
Table 2 Micrograms of Caffeine Quantified in the Receptor Fluid at 15 mins, 1 hr and 2 hrs Under Neutral Conditions
Table 3 Rate of Caffeine Quantified in the Receptor Fluid at 15 mins, 1 hr and 2 hrs Under Neutral Conditions
Table 4 Rate of Caffeine Considering the Caffeine Quantified After 2 hrs When the Negative Control Was Applied Under Neutral Conditions as 100%
Figure 4 Rate of caffeine considering the caffeine quantified after 2 hrs when the negative control (NC) was applied under neutral condition as 100%.
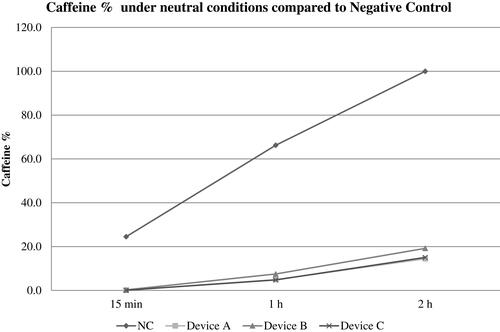
Table 5 Micrograms of Caffeine Quantified in the Receptor Fluid at 15 mins, 1 hr and 2 hrs Under Acidic Conditions
Table 6 Rate of Caffeine Quantified in the Receptor Fluid at 15 mins, 1 hr and 2 hrs Under Acidic Conditions
Table 7 Rate of Caffeine Considering the Caffeine Quantified After 2 hrs When the Negative Control Was Applied Under Acid Conditions as 100%
Table 8 pH Measurements
Figure 5 Rate of caffeine considering the caffeine quantified after 2 hrs in the negative control as 100% under acidic conditions.
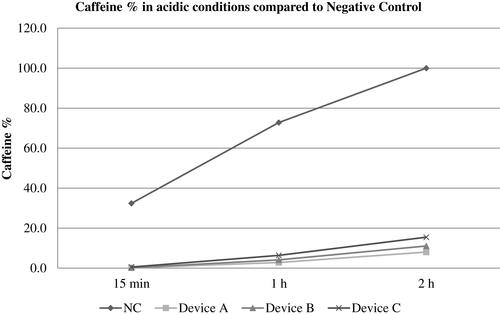
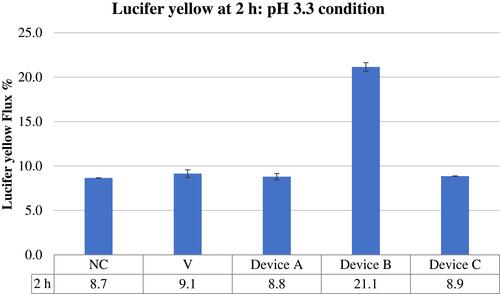
Figure 6 Lucifer yellow flux after 2 hrs of treatment followed by product washing under neutral conditions.
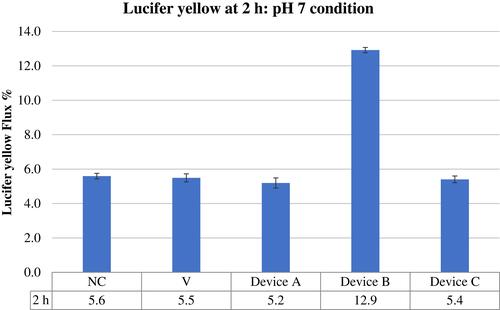
Figure 7 Luciferase yellow flux after 2 hrs of treatment followed by product washing under acidic conditions.