
Figures & data
Figure 1 CEP device. (A) Positioned in the aortic arch providing full coverage of all three major aortic branches. (B) A fluoroscopic image of the device.
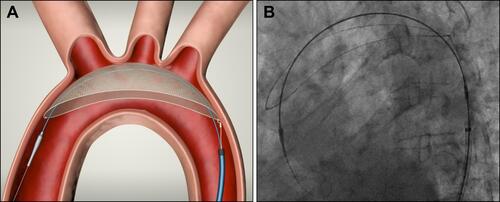
Figure 2 The in vitro efficacy simulator. (A) real and (B) Schematic presentation of the efficacy simulator. Black arrows indicate flow direction.
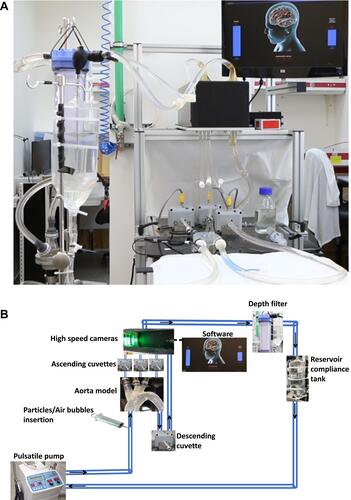
Table 1 The Count and Percent (%) of Particles in the Ascending Major Aortic Arches and the Descending Aorta, in 200 µm and 300 µm, with vs Without the CEP Device as Observed in Six Independent Experiments
Table 2 The Count and Percent (%) of Air Bubbles in the Ascending Major Aortic Arches and the Descending Aorta, in 200µm and 300 µm, with vs Without the CEP Device as Observed in Three Independent Experiments
Table 3 Pool Analysis of Count and Percent, for Particles and Air Bubbles in Ascending Branches and Descending Aorta, in 200 µm and 300 µm, with vs Without the CEP Device
Table 4 Confidence Intervals and Efficacy Rates for Air Bubbles and Particles of 200 µm and 300 µm
Table 5 Total Amount and Distribution (%) of Particles, in Different Sizes (200 µm and 300 µm), to Enter Each of the Ascending Major Aortic Arches