
Figures & data
Figure 1 Simultaneous recording of the brain and conventional skin pulse oximetry waveforms in a single normal sheep brain. The dashed lines represent the start of the skin pulse. The brain and skin pulses were distinct, with the brain pulse demonstrating a waveform similar in shape and timing to a central venous pressure waveform, with A, C, X, V and Y waves, whereas the skin pulse demonstrated a waveform similar in shape and timing to an arterial pressure waveform. In addition, the start of the brain pulse was delayed relative to the skin pulse, by around 100 ms (arrow) and the peak of the pulse was at the end of diastole.
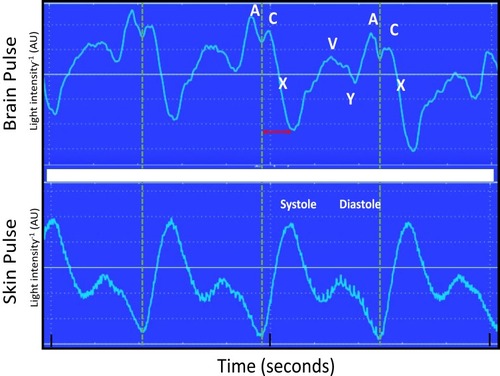
Figure 2 Simultaneous display of the modified ratio of ratios (RRm) and brain oximeter pulse waveform in a single normal animal. The blood oxygen saturation (SO2) and the modified ratio of ratios (right) (Y-axis). The dashed line demonstrates the start of each systole, indicated by the start of the X wave. Systole was temporally associated with a rapid increase in oxygen levels. Thereafter, levels fell during diastole. The lowest oxygen value was at the end of diastole.
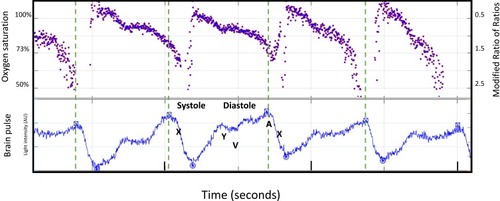
Figure 3 Responses to 5 sequential cranial vault injections of blood. Top panel: blood pressure (red), intracranial pressure (blue) and cerebral perfusion pressure (yellow). Each injection caused an immediate increase in the intracranial pressure (ICP) and drop in cerebral perfusion pressure (CPP). Blood pressure increased by 60 s and ICP fell, leading to a recovery in CPP. Middle panel: oxygen saturations and modified ratio of ratios (within figure Y axes) for brain (blue) and skin (orange) pulse oximeters. For the last 4 injections, the initial fall in CPP was also associated with a fall in brain oximeter oxygen levels (purple shading). The recovery in CPP was associated with a marked increase in brain oximeter oxygen levels (green shading). A second fall in brain oxygen levels (grey shading) occurred at ~150 s. Bottom panel: the brain oximeter pulse amplitude (blue) increased markedly, following the last 3 injections, but did not change with the skin pulse oximeter (orange). The oxygen saturation represents the average microvascular levels over the entire cardiac cycle. Pulse oximetry data represent the average for 7 sheep. The pressure data represent the average for 5 sheep. Each cranial vault injection commenced at time = 0.
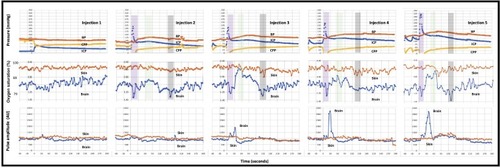
Figure 4 Responses to the third injection of blood into the cranial vault. Top panel: intracranial, blood and cerebral perfusion pressures: The injection caused an immediate increase in the intracranial pressure and drop in cerebral perfusion pressure. Blood pressure increased by 60 s and intracranial pressure fell, leading to a recovery in cerebral perfusion pressure. Middle panel: brain and skin pulse oximeter oxygen levels: the fall in cerebral perfusion pressure was associated with a fall in brain oxygen saturation to 78%. The recovery in cerebral perfusion pressure was associated with an increase in brain oxygen saturation to 94% at 60 s. A further fall in brain oxygen saturation to 77% occurred at 150 s. Skin oxygen levels remained stable. Bottom panel: brain and skin pulse oximeter pulse amplitude levels: The amplitude of the brain oximeter pulse demonstrated a marked increase, but not with the conventional skin pulse oximeter, following the injection. The oxygen saturations represent the average microvascular oxygen level over the entire cardiac cycle for each pulse. Pulse oximetry data represent the average for 7 sheep. The pressure data represent the average for 5 sheep. Each cranial vault injection commenced at time = 0.
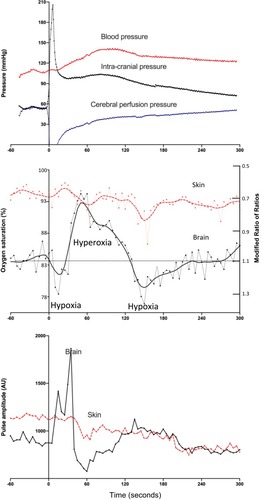
Figure 5 Simultaneous recording of brain and conventional skin pulse oximetry waveforms during a period of raised intracranial pressure (>40 mmHg) following an injection of blood deep into the brain of an animal. Dashed lines mark the start of each skin pulse. The brain oximeter pulse waveform demonstrated a high-frequency oscillation (~7 Hz). These oscillations were not present in the skin pulse. Oscillations at this frequency in intracranial pressure recordings have been documented and represent movement or “ringing” of the brain in response to the systolic pressure wave entering the brain.
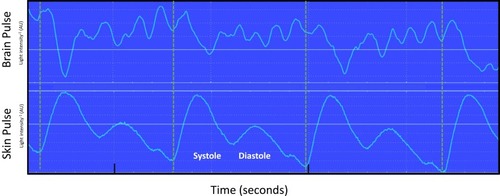
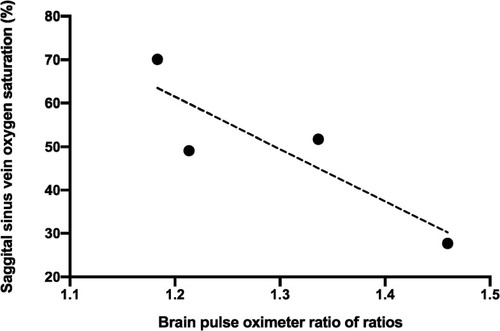
Figure 6 The correlation between oxygen saturation measured in sagittal sinus venous blood gas samples and the modified ratio of ratios of the brain oximeter. R2 0.77, p = 0.12. The data are from a single animal.
Availability of Data and Materials
The datasets used and/or analysed during the current study are available from the corresponding author on reasonable request.