Figures & data
Table 1 Non-ECG Continuous Variables Tested for Inclusion in the Predictive Model for Left Ventricular Mass Index (LVMI)
Table 2 Non-ECG Categorical Variables Tested for Inclusion in the Predictive Model for Left Ventricular Mass Index (LVMI)
Table 3 ECG Continuous Variables Tested for Inclusion in the Predictive Model for Left Ventricular Mass Index (LVMI)
Table 4 Stepwise Forward Selection Method for Construction of Multiple Linear Regression Model Predictive of LVMI
Figure 1 Scatter plots of ECG variables against the dependent variable (LVMI). (A) Sum total of deflections in augmented limb leads (ALL) (R=0.64). (B) Sum of deflection of R wave in aVL and S wave in V3, Cornell Voltage(CV) (R=0.53).
Abbreviation: LVMI, left ventricular mass index.
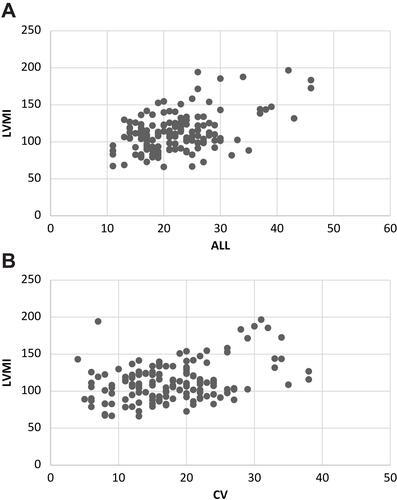
Table 5 Best Fit Model for LVMI with Retained Significant Predictors
Figure 2 (A) Histogram of standardised residuals indicating normal distribution. All residuals are lying within the limit of 3 SDs. (B) Scatter plot of standardised residuals against standard predicted values. The dots are uniformly distributed on either side of the horizontal line at the level of standardised residual=0. The plot shows homogeneity of variance at different standardised predicted values.
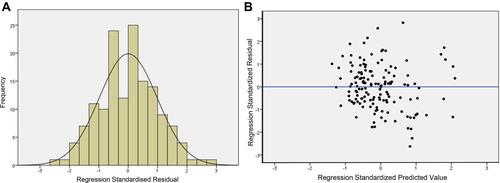
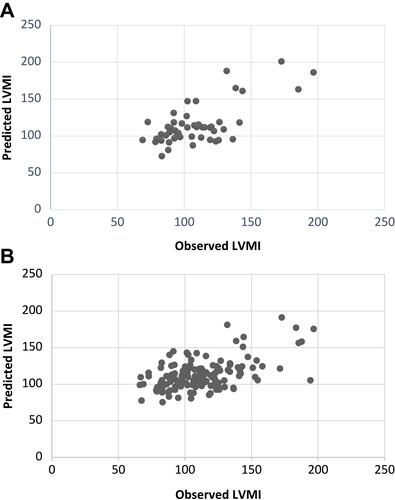
Figure 3 (A) Scatter plot of predicted against the observed values of LVMI in the hold-out validation method (R=0.69). (B) Scatter plot of predicted against the observed values of LVMI in the leave-one-out validation method (R=0.62).
Abbreviation: LVMI, left ventricular mass index.