
Figures & data
Table 1 Patient Demographic Characteristics After Matching
Table 2 Patient Clinical Characteristics After Matching
Table 3 Hospital/Provider Characteristics After Matching
Figure 1 Standardized mean differences before and after matching*.
Note: *A standardized mean difference <0.10 is considered indicative of good covariate balance.
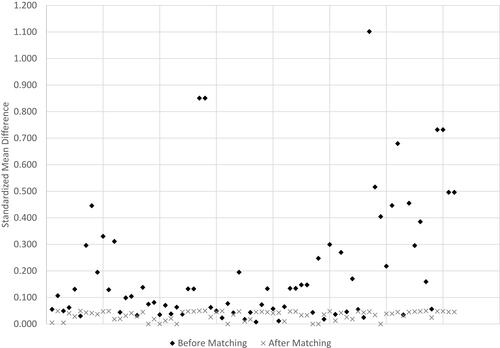
Table 4 Distribution of Observed Diagnoses and Procedures for Hemostasis-Related Complications During the Surgical Admission
Figure 2 Incidence proportion* of patients with hemostasis-related complications during the surgical admission after matching (primary outcome).
Notes: *There were 11 patients with hemostasis-related complications in the SIG group and 3 patients with hemostasis-related complications in the GST group (see for component diagnoses); the risk difference between the SIG group and GST group was 1.63% (95% CI, 0.15–3.11%, P=0.031); the Generalized Estimating Equations-based odds ratio (SIG = reference) accounting for hospital-level clustering via an exchangeable correlation matrix and robust standard errors was 0.28 (95% CI, 0.13–0.60, P=0.0012).
Abbreviations: GST, ECHELON FLEX™ GST system; SIG, SigniaTM Stapling System.
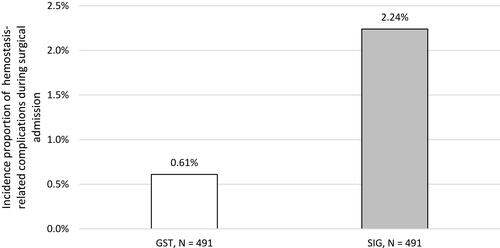
Table 5 Distributions of Total Hospital Costs, Length of Stay, and Operating Room Time for the Surgical Admission After Matching (Secondary Outcomes)*
Table 6 Incidence Proportions of All-Cause Inpatient Readmission After Matching (Secondary Outcome)