Figures & data
Table 1 Demographic and Preoperative Data for Patients Treated with the Porous Plate (Model M4) and Silicone Plate (Model FP7) Ahmed Glaucoma Valves
Table 2 Comparison of Efficacy and Complications in Patients Treated with the Porous Plate (Model M4) and Silicone Plate (Model FP7) Ahmed Glaucoma Valves
Figure 1 Mean intraocular pressure after M4 and FP7 Ahmed Glaucoma Valve implantation. The intraocular pressure was significantly reduced in both groups compared with baseline (P < 0.05 at all time points). Comparisons of the individual time points showed no significant differences.
Abbreviations: Pre, before surgery; D, day(s); M, month(s).
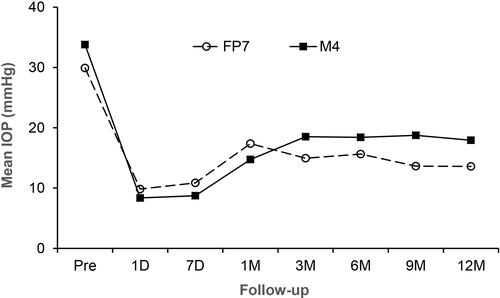
Figure 2 Number of glaucoma medications at baseline and postoperatively after M4 and FP7 Ahmed Glaucoma Valve implantation. The number of medications was significantly reduced in both groups compared with baseline (P < 0.05 at all time points). There were no significant differences at any time point in comparisons between the two groups.
Abbreviations: Pre, before surgery; D, day(s); M, month(s).
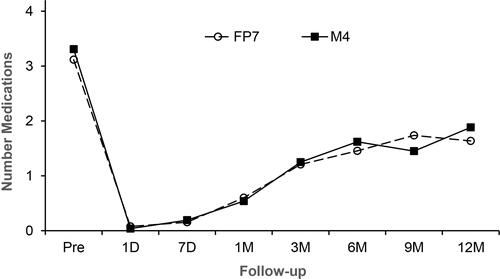
Figure 3 Kaplan–Meier curve cumulative probability of success in patients treated with model M4 and model FP7 Ahmed Glaucoma Valve implantation. Success was defined as 5 mmHg ≤intraocular pressure ≤21 mmHg (with or without medications), without loss of light perception and without additional glaucoma procedures. The success of eyes after model FP7 was significantly higher compared with model M4 implantation (P = 0.005).
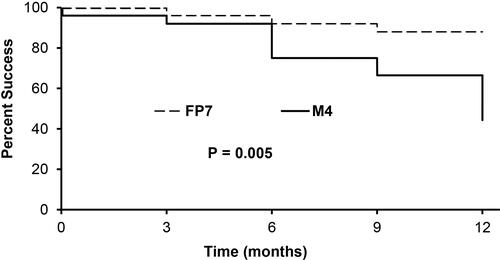
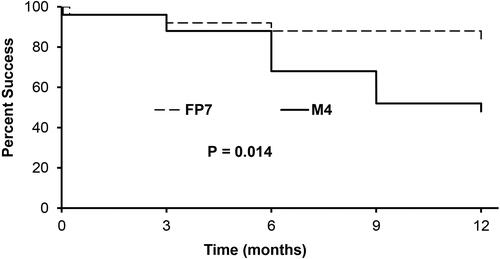
Figure 4 Kaplan–Meier curve cumulative probability of success in patients treated with model M4 and model FP7 Ahmed Glaucoma Valve implantation. In this analysis, success was defined as 30% lowering of intraocular pressure from baseline (with or without medications), without loss of light perception and without additional glaucoma procedures. The success of eyes after model FP7 was significantly higher compared with model M4 implantation (P = 0.014).