Figures & data
Table 1 Baseline Patient Demographics and Characteristics
Table 2 Baseline Diabetes Regimen
Figure 1 Mean changes in A1C (A) and insulin TDD (B) over time with V-Go use compared to baseline. A1C (%) and prescribed TDD (U/day) were both significantly reduced (P<0.0001 at 3 and 7 months compared to baseline). N= 283.
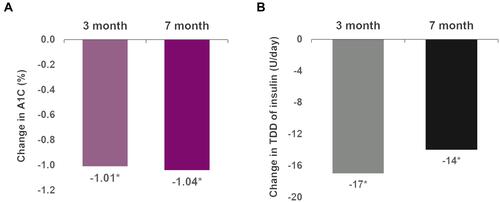
Figure 2 Achievement of A1C targets thresholds at baseline and after 7 months of V-Go use. Percent of patient achievement for A1C target thresholds (<7%, <8% and ≤9%) are shown to the left of dotted line. Percentages are cumulative and represent the total percentage of patients achieving each specific target threshold. A1C values >9% indicate a negative performance indicator for diabetes care and are associated with a higher risk for complications and comorbidities. The percentage of patients in this high-risk threshold are shown to the right of the dotted line. Significant (P<0.001) increases were observed in the percent of patients achieving A1C targets of ≤9% and <8%, and a significant (P<0.001) decrease in the percent of patient considered high risk (A1C>9.0%) after 7 months of V-Go use.
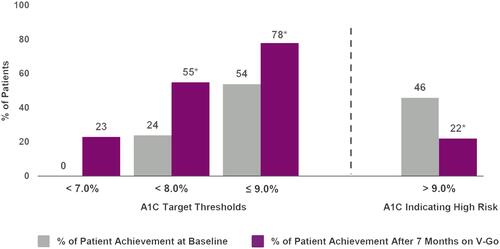
Table 3 Changes in A1C and TDD in Population by Baseline Insulin Regimen Prior to V-Go
Table 4 Changes in A1C and TDD in Basal-Bolus Population Based on Baseline Insulin TDD Tertiles
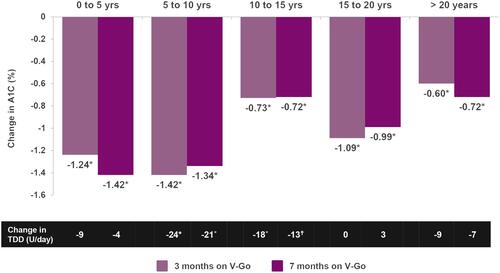
Figure 3 Mean changes in A1C and insulin TDD over time with V-Go use based on duration of diabetes. Patients with known duration of diabetes (N=186) were stratified based on 5 diabetes duration strata (n= 16, 37, 49, 38 and 46, respectively). Reductions in A1C (%) were significant (*P< 0.01) at both 3 and 7 months across all strata. Changes in TDD of insulin (U/day) reflect the difference in prescribed TDD after a mean of 7 months of V-Go use compared to prescribed TDD prior to V-Go use Reductions in TDD were observed across 4 of the 5 strata with significant (*P<0.01, †P<0.05) reductions observed in the two strata (5 to 10-year duration and 10 to 15-year duration) with the highest prescribed TDD at baseline.