Figures & data
Figure 1 Illustration of the µCor device in the side location of a subject. The device emits radiofrequency signals which propagate through the lungs and are reflected back to the device. Changes in the reflected radar wave signal indicate changes in fluid accumulation.
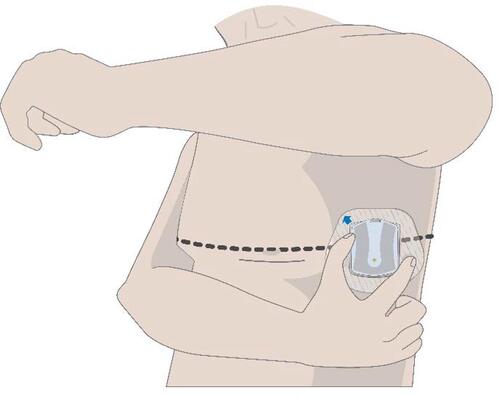
Table 1 Demographic Data of the Subjects Enrolled
Table 2 Individual Pearson r Correlations of UFV vs TFI with Corresponding Number of Measurements. The Fisher’s Mean r with 95% CI is Reported
Figure 2 Individual plots by subject of TFI vs UFV (mL) are shown. The number above each plot corresponds to the individual subject study identification number.
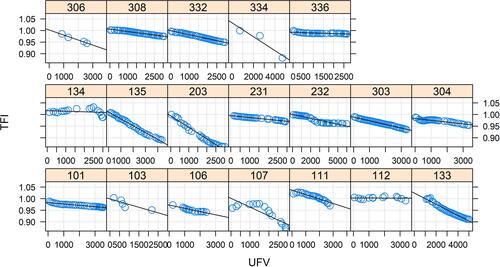
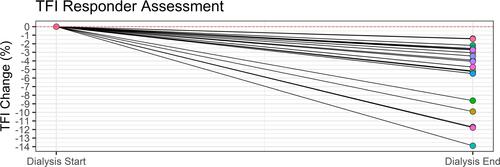
Figure 3 TFI Responder analysis showing percent change in TFI from beginning of dialysis to the end of dialysis. Some subjects experienced greater absolute TFI changes than other subjects.