Figures & data
Figure 1 Phybrata sensor attached to the mastoid using an adhesive patch.
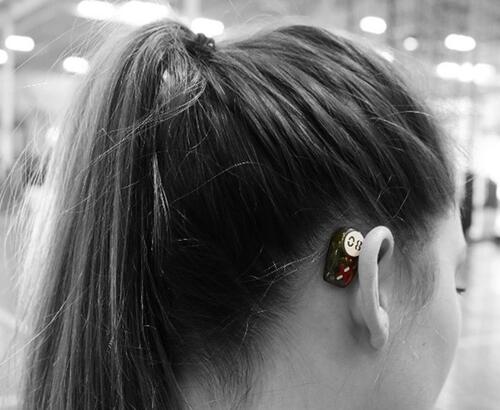
Figure 2 Sample eyes open (Eo) and eyes closed (Ec) x(anterior-posterior, AP), y(vertical), z(medial-lateral, ML) acceleration time series data and AP/ML acceleration spatial scatter plots for age/gender-matched (A) healthy baseline participant (B) patient with diagnosed concussion.
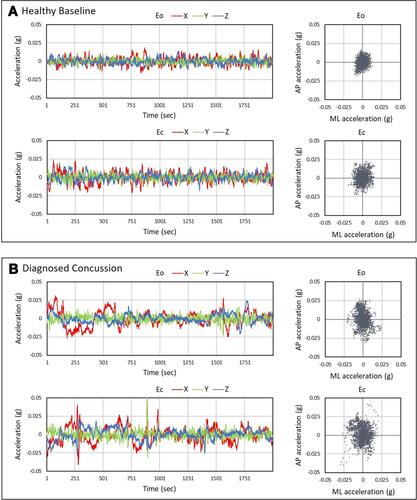
Table 1 ANOVA Summary of Phybrata Measurements vs. Eye State and Gender for 83 Healthy Baseline Patients (43F, 40M).
Table 2 ANOVA Summary of Phybrata Measurements vs. Eye State and Gender for 92 Patients (51F, 41M) with Diagnosed Concussions.
Table 3 MANOVA Summary of 4 Phybrata Metrics for Patient Sub-Populations with and without (a) Concussion (CN); (b) Vestibular Impairment (VI); (c) Neurological Impairment (NI).
Figure 3 Cumulative probability distributions vs. gender and eye state for phybrata metrics for: (A and B), 83 healthy baseline patients (HB); (C and D), 92 patients with diagnosed concussions (CN).
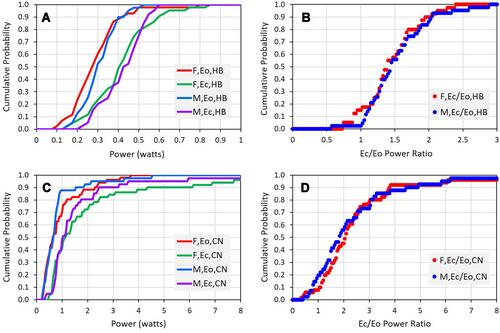
Figure 4 Box plots showing distributions of 4 phybrata metrics for 83 healthy baseline patients (HB) and 92 patients with diagnosed concussions (CN).
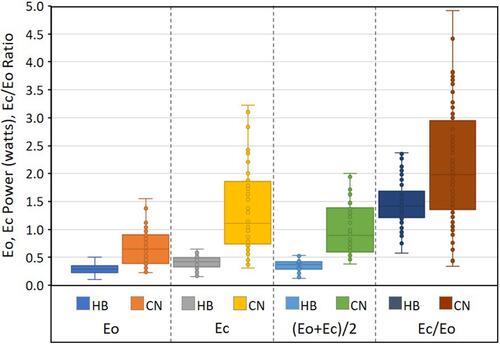
Figure 5 Eyes open (Eo) and eyes closed (Ec) phybrata power histograms (left) and anterior-posterior/medial-lateral (AP/ML) acceleration spatial scatter plots (right) for (A) baseline testing of 5 healthy athletes; (B) post-concussion testing of 5 athletes with vestibular impairments; (C) post-concussion testing of 5 athletes with neurological impairments.
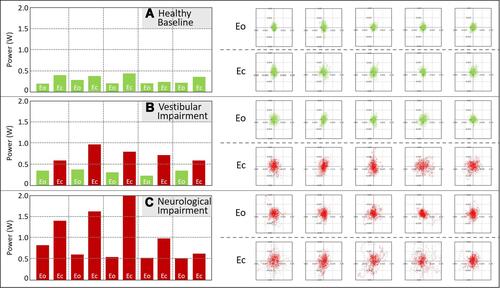
Figure 6 Box plots and graphs comparing means of 4 phybrata metrics (A) Eo (B) Ec/Eo (C) Ec (D) (Eo+Ec)/2 for 83 healthy baseline patients (HB); 26 concussion patients with vestibular impairments (VI) only; 40 concussion patients with neurological impairments (NI) only; 26 concussion patients with both vestibular and neurological impairments (VNI).
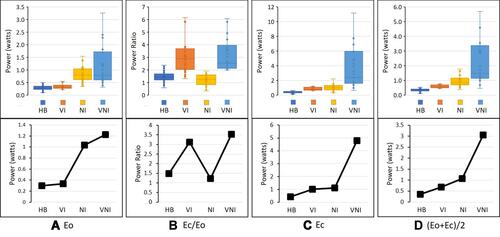
Figure 7 Scatter plots of Ec/Eo power ratio vs. Eo power for healthy baseline patients (HB) and concussion patients with vestibular impairments (VI), neurological impairments (NI), and both vestibular and neurological impairments (VNI).
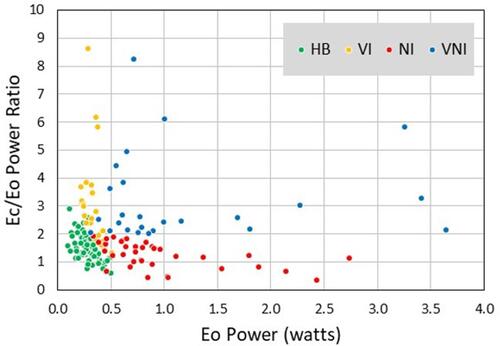
Table 4 Summary of Receiver Operating Characteristic (ROC) Curves for (Eo+Ec)/2 as a Diagnostic Measure for Concussion (CN), Ec/Eo as a Diagnostic Metrics for Vestibular Impairment (VI), and Eo as a Diagnostic Measure for Neurological Impairment (NI).
Figure 8 Receiver operating characteristic (ROC) curves for 4 clinical diagnostic criteria: (A) concussion (CN=0,1); (B) vestibular impairment (VI=0,1); (C) neurological impairment (NI=0,1); and (D) both vestibular and neurological impairments (VNI), for all possible cutoff values of the 4 phybrata metrics Eo, Ec, (Eo+Ec)/2, Ec/Eo.
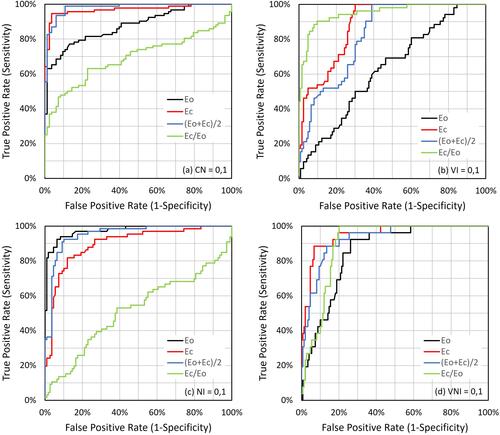
Figure 9 Normalized ensemble eyes-open (Eo) anterior-posterior (AP) time-resolved phybrata power spectral density (NPSD) plots (left) and spectrograms (right) for (A and B) baseline testing of 5 healthy patients; (C and D) post-concussion testing of 5 patients with vestibular impairment; (E and F) post-concussion testing of 5 patients with neurological impairment.
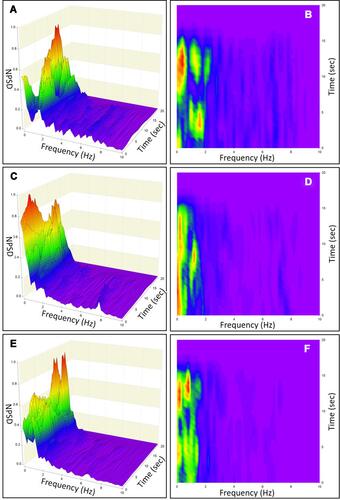
Figure 10 Normalized ensemble eyes-closed (Ec) anterior-posterior (AP) time-resolved phybrata power spectral density (NPSD) plots (left) and spectrograms (right) for (A and B) baseline testing of 5 healthy patients; (C and D) post-concussion testing of 5 patients with vestibular impairment; (E and F) post-concussion testing of 5 patients with neurological impairment.
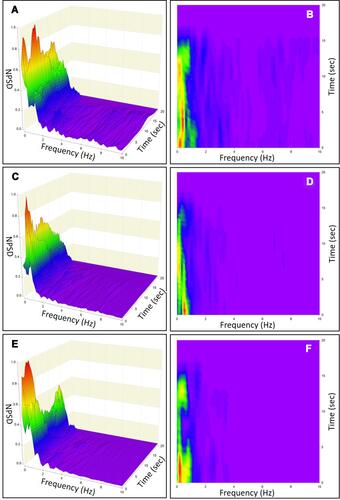
Figure 11 Normalized ensemble eyes-open (Eo) medial-lateral (ML) time-resolved phybrata power spectral density (NPSD) plots (left) and spectrograms (right) for (A and B) baseline testing of 5 healthy patients; (C and D) post-concussion testing of 5 patients with vestibular impairment; (E and F) post-concussion testing of 5 patients with neurological impairment.
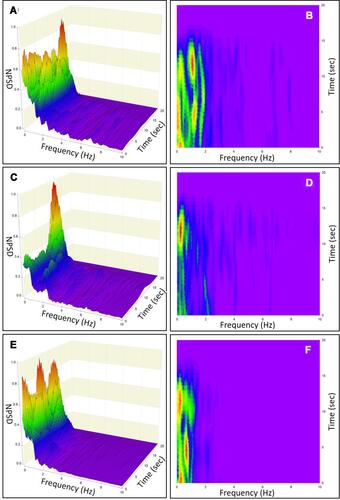
Figure 12 Normalized ensemble eyes-closed (Ec) medial lateral (ML) time-resolved phybrata power spectral density (NPSD) plots (left) and spectrograms (right) for (A and B) baseline testing of 5 healthy patients; (C and D) post-concussion testing of 5 patients with vestibular impairment; (E and F) post-concussion testing of 5 patients with neurological impairment.
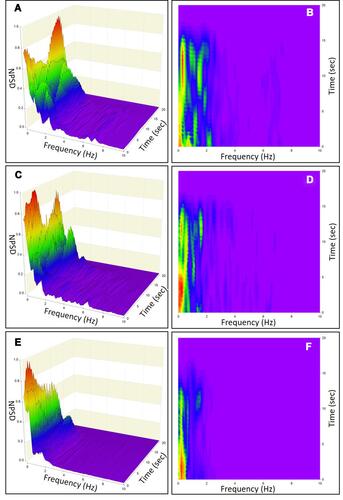
Figure 13 Change in normalized ensemble power spectral density (PSD) between eyes-open (Eo) and eyes-closed (Ec) for 5 healthy baseline patients (HB). Ensemble average {AP, ML} PSD changes are summed over phybrata frequency bands corresponding to visual, vestibular, central nervous system (CNS), and proprioceptive control.
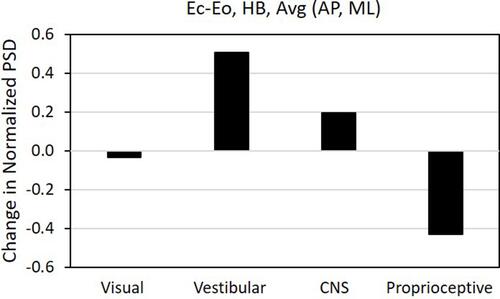
Figure 14 Change in normalized ensemble power spectral density (PSD) between 5 healthy baseline patients (HB) and: 1) 5 concussion patients with vestibular impairment (VI); and 2) 5 concussion patients with neurological impairment (NI). For each group, ensemble average {Eo, Ec, AP, ML} PSD changes are summed over phybrata frequency bands corresponding to visual, vestibular, central nervous system (CNS), and proprioceptive control.
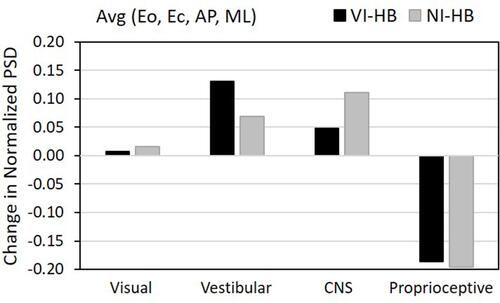
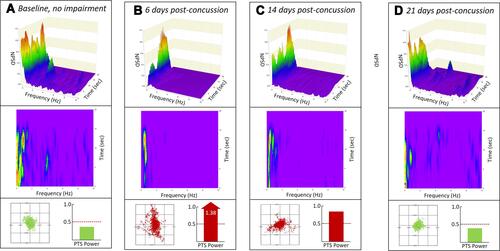
Figure 15 Normalized eyes-closed (Ec) anterior-posterior (AP) time-resolved phybrata power spectral density (NPSD) plots (top) and spectrograms (middle), along with phybrata spatial scatter plots (bottom, left), and phybrata power bar graphs (bottom, right) for an athlete tested (A) healthy/baseline; (B) 6 days post-concussion with neurological impairment; (C) 14 days post-concussion; and (D) 21 days post-concussion.