Figures & data
Figure 1 Improvement in SIJ pain (top), Oswestry Disability index (middle) and EuroQOL-5D time trade-off index over time comparing the current study (SALLY, green) with two prior randomized trials (INSITE6 [black] and iMIA8 [orange]), both of which compared SIJ fusion (solid lines) to non-surgical management (dotted lines) and a large single-arm trial SIFI7 (blue solid line).
![Figure 1 Improvement in SIJ pain (top), Oswestry Disability index (middle) and EuroQOL-5D time trade-off index over time comparing the current study (SALLY, green) with two prior randomized trials (INSITE6 [black] and iMIA8 [orange]), both of which compared SIJ fusion (solid lines) to non-surgical management (dotted lines) and a large single-arm trial SIFI7 (blue solid line).](/cms/asset/50516b6f-0ac5-4d88-9250-e63158967b6c/dmde_a_12171735_f0001_c.jpg)
Figure 2 Change in proportion reporting minimal difficulty performing activities related to chronic low back/pelvic pain.
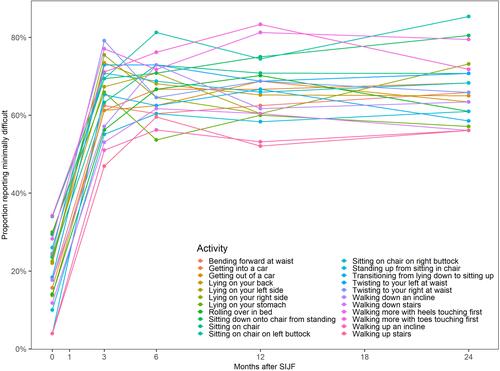
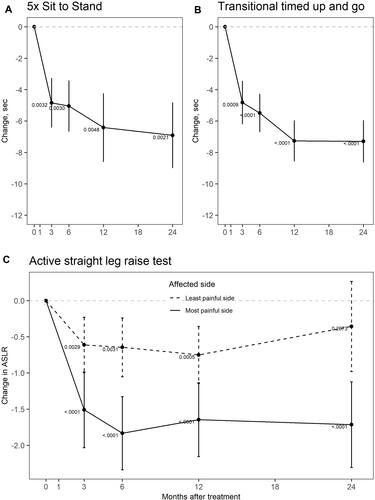
Figure 3 Improvement in performance on functional tests before and 3, 6, 12 and 24 after SIJF. Top left panel shows mean time to complete 5 times sit-to-stand. Top-right panel (A,B) show mean time for transitional timed up and go. The bottom panel (C) shows mean ratings on active straight leg raise test. Small numbers are p-values from one-sample two-tailed t tests. Values shown are mean and 95% confidence limits.