Figures & data
Figure 1 Block diagram of the cervix type classification system.
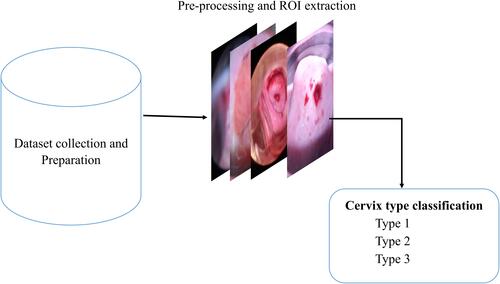
Figure 2 Block diagram of the cervical cancer classification system.
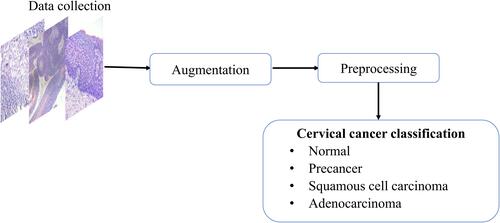
Figure 3 Performance of ROI detection model (A) Training loss (B) Validation loss.
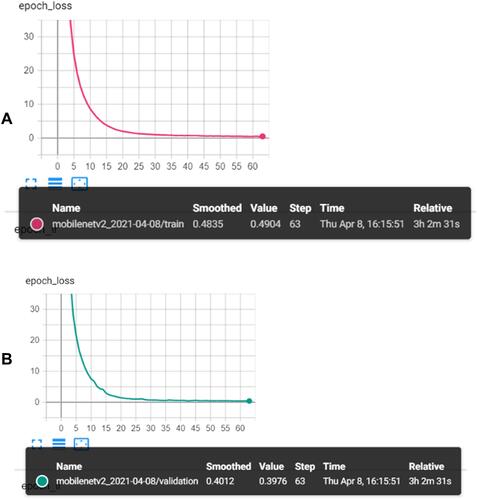
Figure 4 Sample results of the Cervix ROI extraction model (A) input images (B) ROI extracted images.
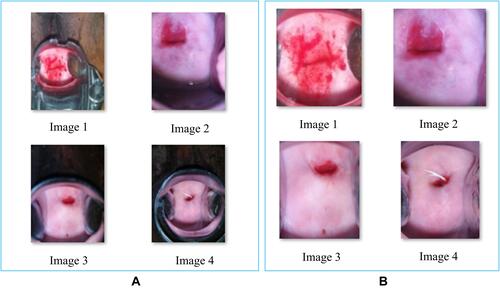
Figure 5 Sample test images and their respective IoU score of ROI detected images.
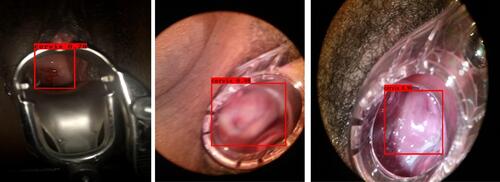
Table 1 Results of Models Trained Using ROI Extracted Data and Raw Data
Figure 6 Training and validation performance of EfficientNetB0 model for cervix type classification (A) Accuracy (B) Loss.
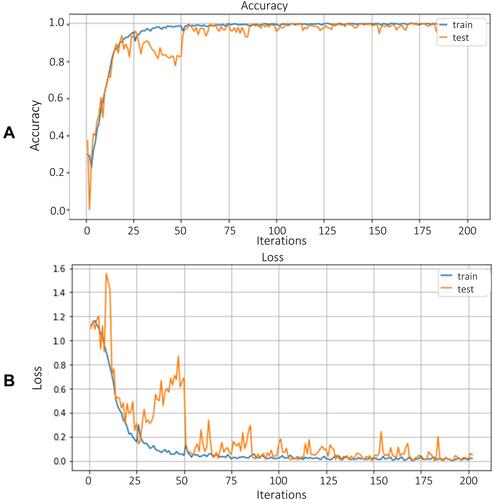
Table 2 Result of Cervix Type Classification with Different Metrics for the Final Model
Figure 7 Test results of EfficientNetB0 model for cervix type classification (A) Confusion matrix (B) ROC-AUC plot.
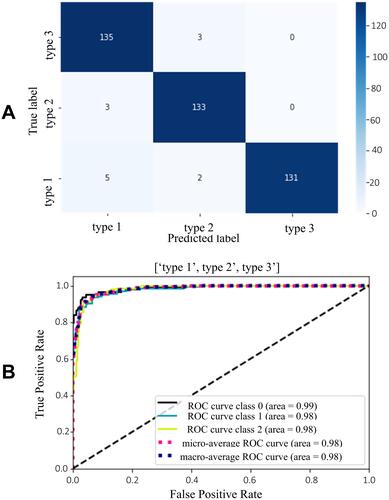
Figure 8 Image augmentation using different degrees of rotation.
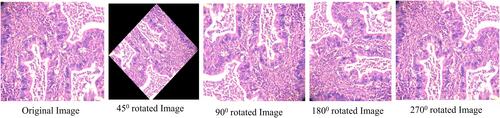
Figure 9 Effect of histogram matching on cervical histopathology sample images (A) Reference image (B) Source images (C) Histogram matched images.
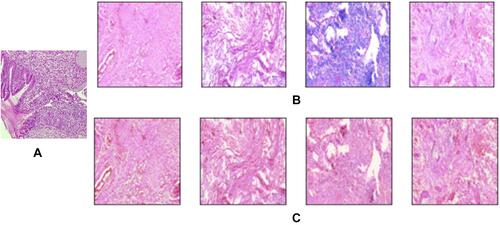
Figure 10 Training and validation performance of EfficientNetB0 model for cervical cancer type classification (A) Accuracy and (B) Loss.
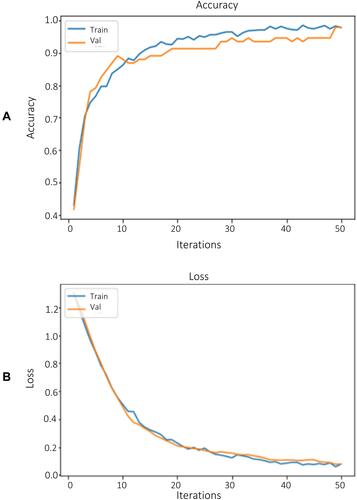
Table 3 Result of Cervical Cancer Classification with Different Metrics
Figure 11 Test results of EfficientNetB0 model for cervical cancer type classification (A) Confusion matrix (B) ROC-AUC plot (0: adenocarcinoma, 1: normal, 2: precancer and 3: squamous cell carcinoma, respectively).
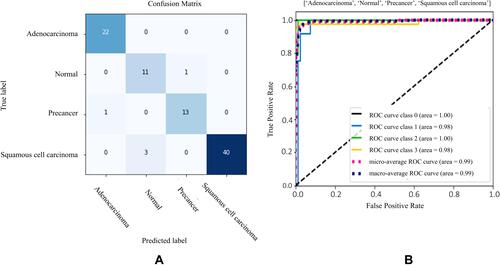
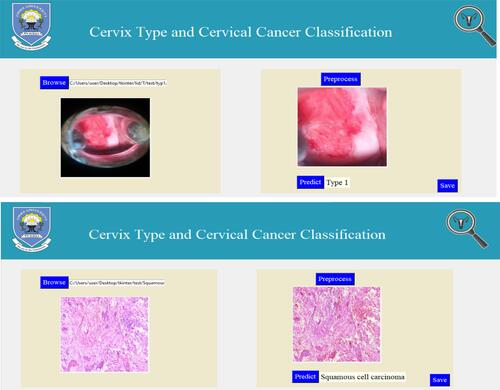
Figure 12 User interface for the proposed cervix type and cervical cancer classification system.