
Figures & data
Figure 1 System design for interface to monitor cycling exercise.
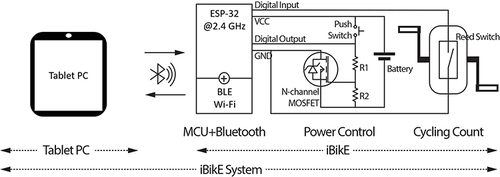
Figure 2 User interface. Users first need to push a button to pair the app with the oximeter and then push the button on the right to pair the app with iBikE equipment.
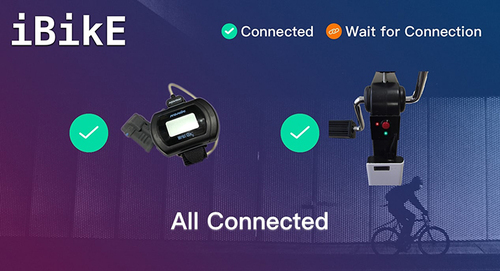
Figure 3 Real-time monitoring of the speed (red line, rpm), pulse rate, and oxygen saturation during cycling.
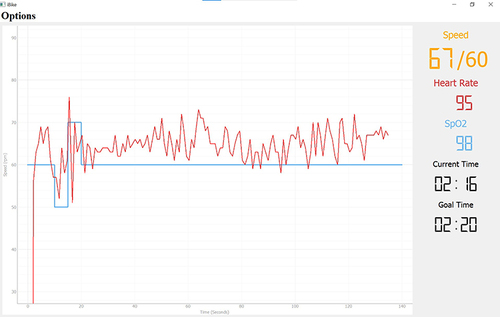
Figure 4 Exercise equipment. The bike is manufactured by AGM. (A) All the components, including the reed switch, push switch, MCU and BLE modules, and power control module are inside the iBikE equipment. (B) The user interface is only a physical button to make it easy to use the equipment. We used a laser tachometer, DT-2100, Nidec-SHIMPO,Citation14 in non-contact continuous measurement mode to detect the measured RPM in real-time to compare the results with data taken from iBikE equipment. Both Wi-Fi and BLE iBikE systems have the same hardware design.
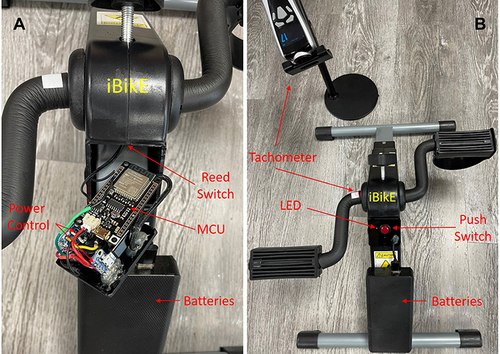
Figure 5 The control and computing module in iBikE exercise equipment.
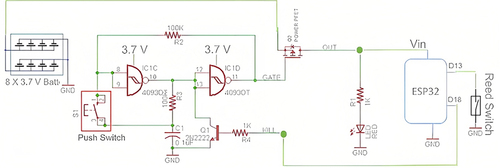
Figure 6 Algorithm flowchart for detection of the real-time cycling intervals in remotely monitored BLE iBikE.
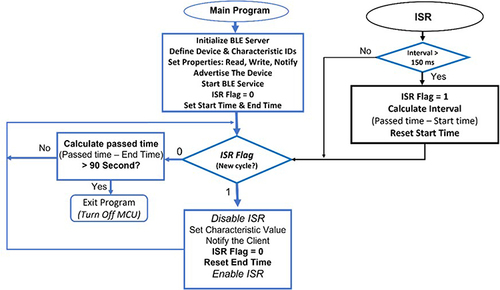
Figure 7 Algorithm flowchart for detection of the real-time cycling intervals in remotely monitored Wi-Fi iBikE.
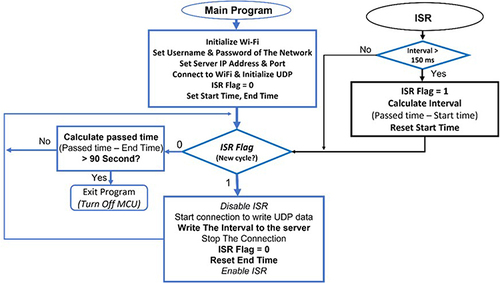
Figure 8 Control buttons in motorized iBikE were replaced by transistors to be controlled with ESP32. ESP32 communicates with the tablet PC through Bluetooth.
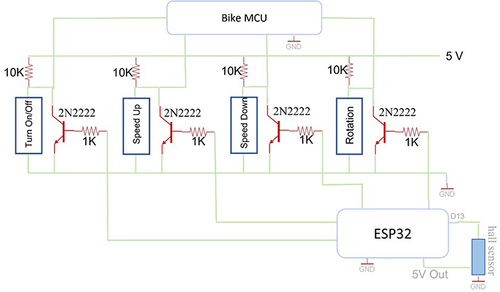
Figure 9 Remotely controlled and monitoring exercise equipment. The motorized bike is manufactured by HOMGIM.
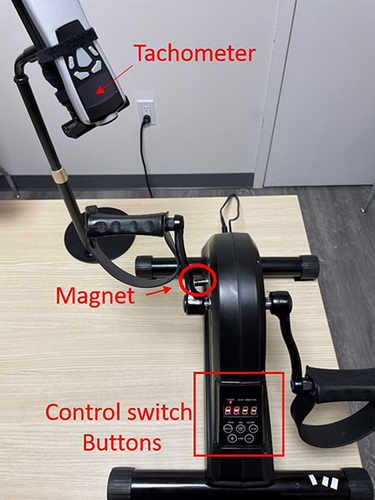
Figure 10 Algorithm flowchart on detection of the real-time cycling intervals in remotely controlled motorized iBikEs.
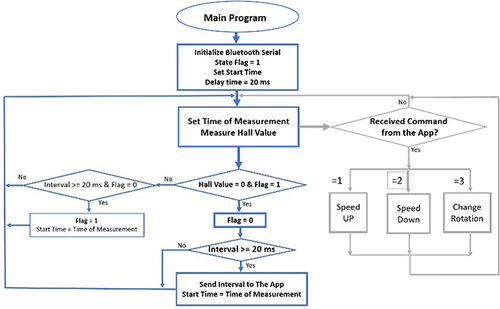
Figure 11 Collected data from BLE, Wi-Fi, and motorized iBikE systems and their representative collected data from the tachometer (in each 1- minute session) was averaged and compared. The results show the capability of our iBikE systems to measure the RPMs accurately.
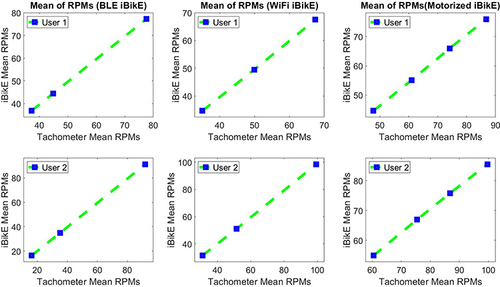
Table 1 RPM Distribution at Different Cycling Paces
Table 2 Confidence Interval Range as Well as Mean and Standard Deviation (SD) of All the Collected Mean Differences Between Wireless Interface and Tachometer in Each Subsection with Similar Bins for Wi-Fi iBikE System
Table 3 Confidence Interval Range as Well as Mean and Standard Deviation (SD) of All the Collected Mean Differences Between Wireless Interface and Tachometer in Each Subsection with Similar Bins for BLE iBikE System