Figures & data
Figure 1 Shows BTrackS TTT (A) set-up and visual of screen during training session. COP is represented by yellow dot inside of target circle. Time on target is indicated in real time for total and all three speed conditions over the duration of the session. BTrackS LOS performance (B) set-up and screen visual is also shown. Screen shows total functional base of support area (cm2) as indicated by blue area on the board as well as quantitatively in the box below. COP is represented by a yellow dot.
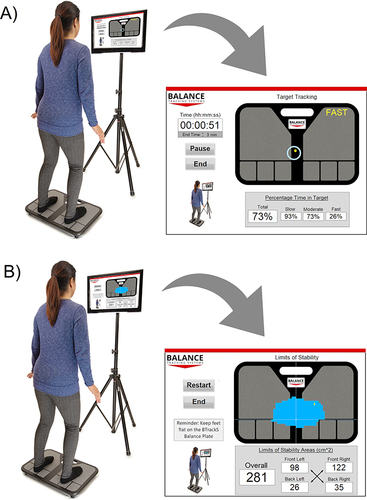
Figure 2 Total 9-week experiment TTT timeline indicating the time requirement and number of sessions, as well as the presence of TTT between Baseline and Post-Baseline LOS tests.
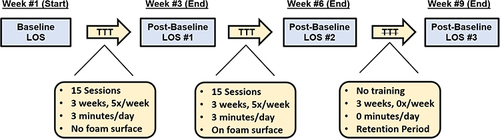
Figure 3 Performance of TTT characterized by differences in Time on Target duration between first and last session for both surface conditions (left side of graphs no foam vs right side foam) and each speed condition ((A) Slow, (B) Moderate, and (C) Fast) are illustrated here. *Indicates statistically significant differences.
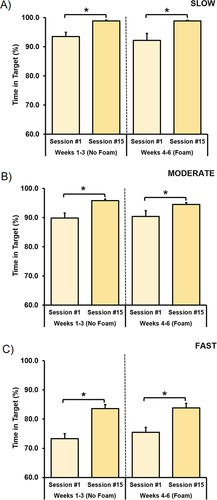
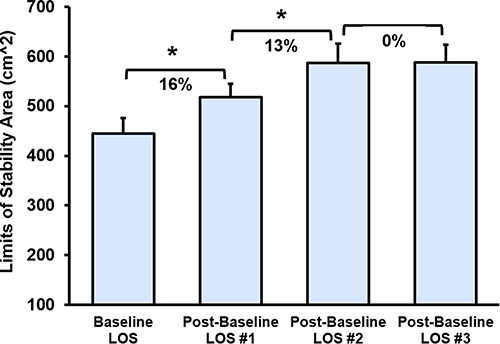
Figure 4 Changes in dynamic balance by way of BTrackS LOS protocol between Baseline and all Post-Baseline LOS test are illustrated here. *Indicates statistically significant differences.