Figures & data
Figure 1 Images of capsular resection liver injury: (A) (untreated) or 10 minutes after application of treatment using (B) FL, (C) F0, or (D) Gauze (scale bar = 1 cm).
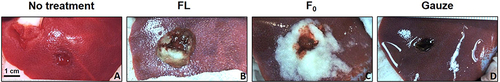
Figure 2 Acute response to capsular resection liver injury: (A) Bleed grade (mean ± standard deviation) and (B) Hemostatic efficacy (% of wounds with hemostasis) 10 minutes after applying FL, F0 or gauze (n=12/group; *For p<0.05).
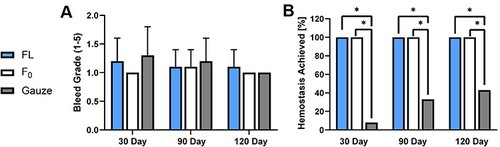
Figure 3 Semi-quantitative histological scores 30, 90 and 120 days after treating capsular resection liver injury with FL, F0 or gauze (mean ± standard deviation (SD); n=12/group).
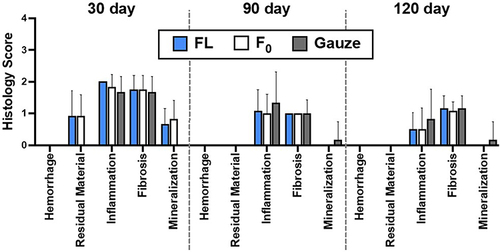
Figure 4 Peritoneal tissue attachment severity scores 30, 90 and 120 days after treating capsular resection liver injuries using FL, F0 or gauze (mean ± standard deviation (SD); n=12/group).
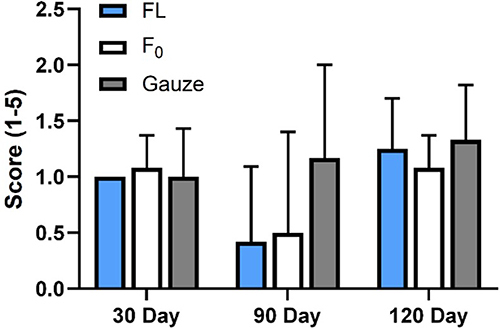
Figure 5 Images of spinal cord injury: (A) Without treatment (left) or 0 and 10 minutes after treatment using FL (middle (B and C)) or F0 (right (D and E)) (scale bar = 1 cm).
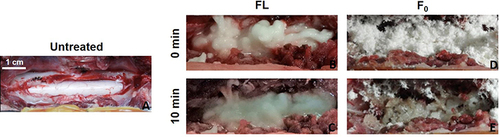
Figure 6 (left) Hematoxylin and eosin (H&E; scale bar = 2 mm) stained sections 45, 90 and 120 days after treating spinal cord injury with FL (A–C) and F0 (D–F); the 120-day F0 section is labeled with spinal cord (SC), edges of laminectomy (LM) and implanted material (MA) as an example; (Far right G)) photograph of representative spine specimen with dotted box showing the approximate location of stained sections in the vicinity of the spinal cord (scale bar = 1 cm).
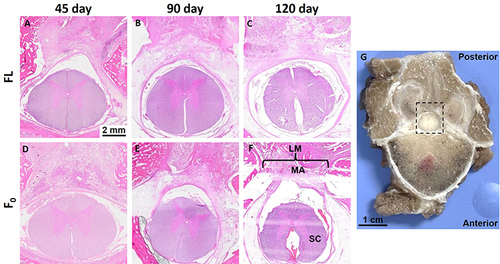
Figure 7 Semi-quantitative inflammatory histological scores 45, 90 and 120 days after treating spinal cord injury with FL and F0 (mean ± standard deviation (SD); n=5–6/group).
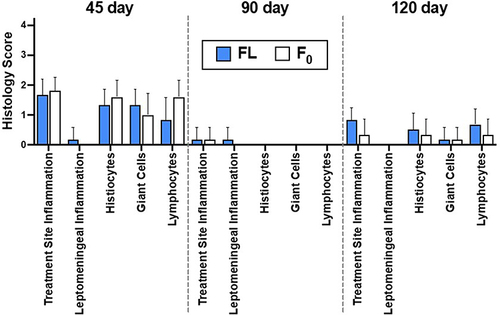
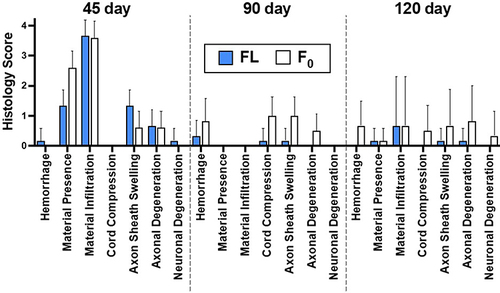
Figure 8 Semi-quantitative general histological scores 45, 90 and 120 days after treating spinal cord injury with FL and F0 (mean ± standard deviation (SD); n=5–6/group).