Figures & data
Figure 1 Positioning for the Three Indicor Tests and the PLR Test Bench. Participants were administered three consecutive Indicor tests separated by 5 minutes in the postural order shown from left to right. Test 1 (Baseline: BL) was in the 45° upright posture, Test 2 was done in the PLR posture (PLR; supine with legs at passive 45° elevation), Test 3 was done again in the 45° upright posture (Recovery; REC). The bench is constructed to easily rock participants between the 45° upright (left) and PLR (middle) postures.
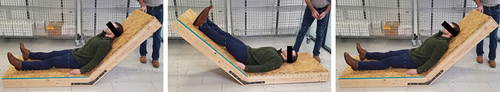
Figure 2 Indicor device. The user holds a hand piece with a disposable mouthpiece filter connected to an expiratory pressure sensor. A photoplethysmography (PPG) probe connected to the hand piece is placed on a finger of the other hand. The expiratory pressure and PPG signals are wirelessly input into the tablet, which automatically guides the user through a 10-second Valsalva maneuver at 20 mmHg effort, and then calculates the Valsalva Pulse Response (VPR).
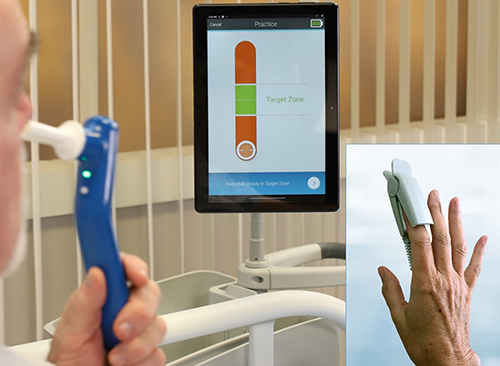
Figure 3 Valsalva Pule Response (VPR) of a Photoplethysmography (PPG) Signal to a Valsalva Maneuver at Head-Up Position, After Passive Leg Raise (PLR), and After Return to Head-Up Position in one typical participant. The signals for each of the 3 Valsalva efforts at each position are shown. Expiratory Pressure = Pressure of an expiratory effort into a mouthpiece leading to closed tube with a pressure transducer, during the 10-second Valsalva maneuver. There are tiny x-marks where the program automatically determines the peaks and valleys.
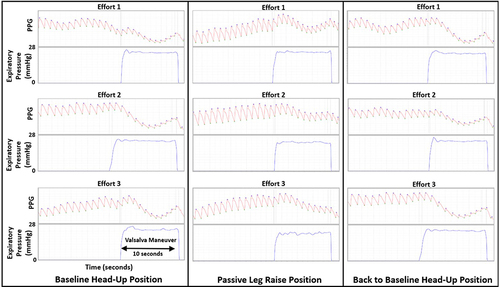
Figure 4 Valsalva Pulse Response Ratio to Passive Leg Raise and Recovery. The ratio of the pulse amplitude at the end of the Valsalva maneuver to the average resting pulse amplitude (Valsalva Pulse Response; VPR) increased from baseline to the passive leg raise posture (PLR) (*p<0.0001 PLR versus Baseline) and returned with the Recovery back to baseline posture. (**p<0.0001 for Recovery versus PLR); Baseline and Recovery are not different from each other. N=30. The blue bars indicate the means; the black brackets indicate the means plus and minus the standard deviations.
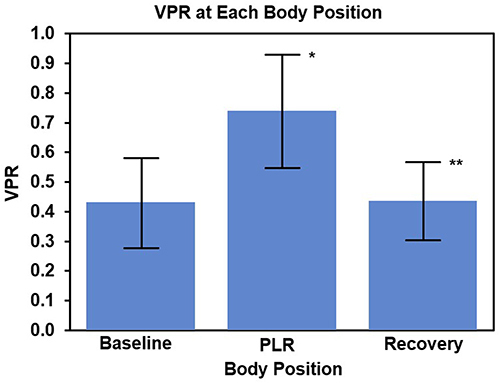
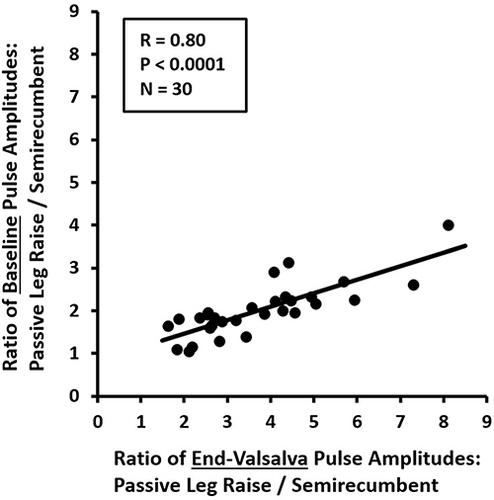
Figure 5 Photoplethysmography Indicators of Change in Stroke Volume vs Change in Cardiac Preload with Passive Leg Raise. Indicator of change in stroke volume = Ratio of Baseline Pulse Amplitudes of Passive Leg Raise/Semirecumbent. Indicator of change in cardiac preload = Ratio of End-Valsalva Pulse Amplitudes of Passive Leg Raise/Semirecumbent. R=0.80, P<0.0001, N=30.