Figures & data
Table 1 E. Coli Strains Characterization
Table 2 Ialuril® Dilutions Preparations for Microdilution Test
Figure 1 Scheme of the anti-bacterial adhesion assay on HBE.
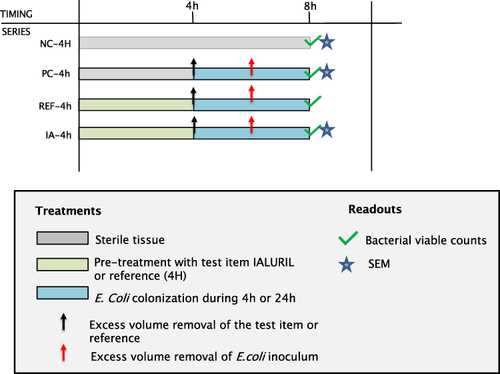
Table 3 Bacterial Viable Counts (Expressed as Log Values) at 4 h and 24 h
Figure 2 Caffeine quantification in the receptor compartment 1 h and 2 h after caffeine application, expressed as a percentage of applied caffeine. HA+CS+CaCl2 significantly reduce the passage of caffeine compared to the untreated NC at both time points.
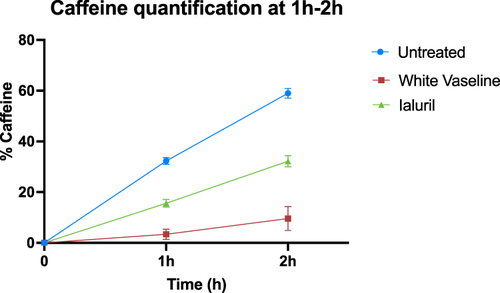
Figure 3 Statistic by “One-way ANOVA with post hoc Tukey HSD Test”: ***p<0.001. Caffeine permeation rate at 1 h (A) and at 2 h (B) after caffeine application, expressed as the percentage of caffeine permeated at 1 h and 2 h with respect to the amount of caffeine present in the apical compartment at each timepoint. Triplicate RHBE tissues for each treatment were used.
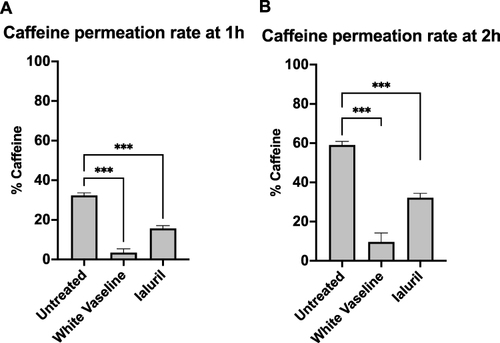
Figure 4 Statistic by “One-way ANOVA with post hoc Tukey HSD Test”: ***p<0.001 on viable counts (as per formula 1) on HBE tissues expressed as Log values after 4 h HA+CS+CaCl2 pre-treatment followed by 4 h colonization. Triplicate HBE tissues for each treatment were used.
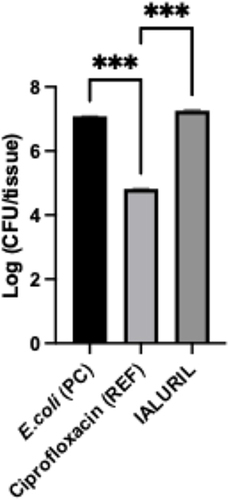
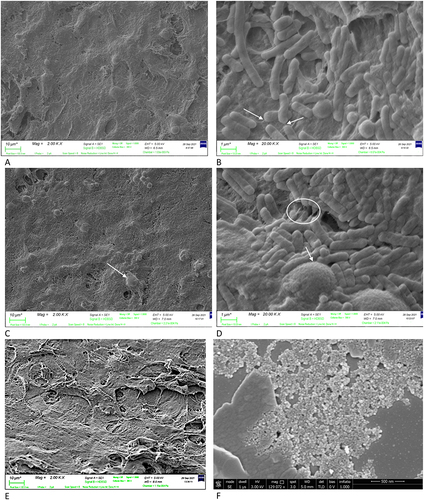
Figure 5 SEM analysis on colonized untreated 3D bladder epithelium (A): 2000x magnification and (B) 20,000x magnification, HA+CS+CaCl2 pre-treated 3D bladder epithelium (4 h pre-treatment with HA+CS+CaCl2 followed by 4 h colonization with E. coli DSM 1103 ((C): 2000x magnification and (D) 20,000x magnification, White arrows indicate bacterial pedestal structures and circles HA+CS+CaCl2 product residues), not colonized untreated 3D bladder epithelium (negative control, (E) 2000x magnification) and Ialuril® (F): 129,072 magnification).