Figures & data
Figure 1 The Echelon+ Stapler with Thunderbird reloads.
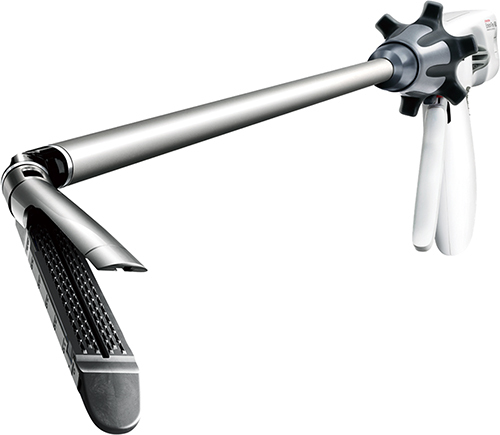
Figure 2 Staple Form Quality categories. Scores of 1–2 were considered well-formed, whereas 3–5 were considered malformed.
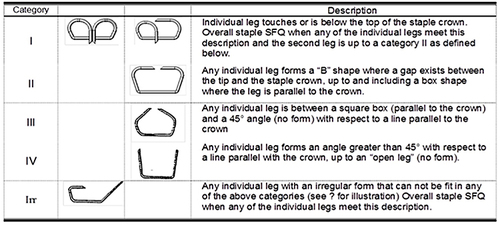
Table 1 Summary of Comparisons Between Staplers
Figure 3 Percentage of malformed staples by SFQ (Staple Form Quality) category for Echelon+ TBGST, Reach Anzhi and Fulbright Lunar staplers in gastric tissue.
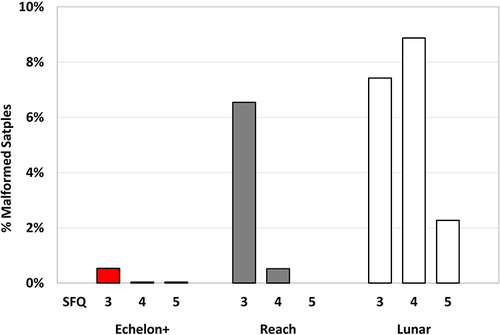
Figure 4 Boxplot of bronchus air leak pressures for Echelon+ TBGST, Reach Anzhi and Fulbright Lunar staplers. Dotted lines represent target minimum values of 88 mmHg. Circles represent individual points, whereas those with a cross show statistical outliers. An asterisk represents a significant difference versus Echelon+ TBGST.
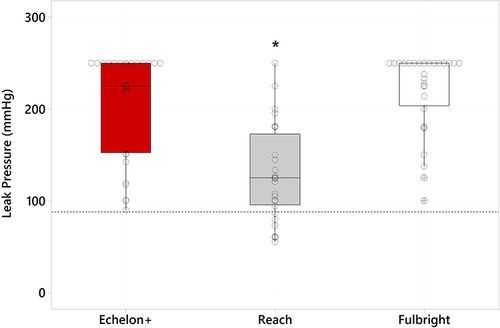
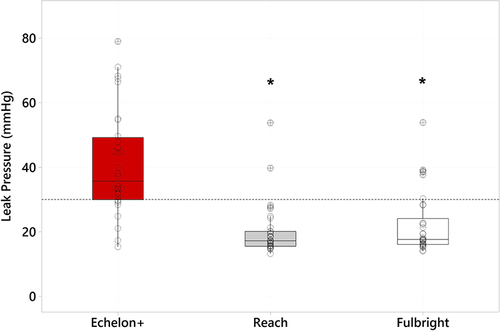
Figure 5 Boxplot of colon fluid leak pressures for Echelon+ TBGST, Reach Anzhi and Fulbright Lunar staplers. Dotted lines represent target minimum values of 30 mmHg. Circles represent individual points, whereas those with a cross show statistical outliers. Asterisks represent a significant difference versus Echelon+ TBGST.