
Figures & data
Figure 1 Postoperative radiograph of a pelvis with a three-hole reconstruction plate spanning the sacroiliac joint.
Note: The ‘L’ represents the patient’s left.
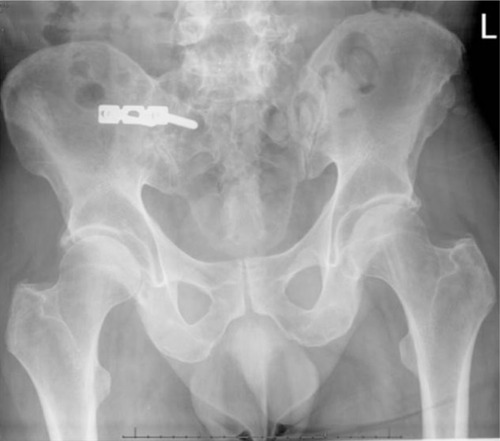
Figure 2 Postoperative radiograph demonstrating placement of three fusion implants across the sacroiliac joint.
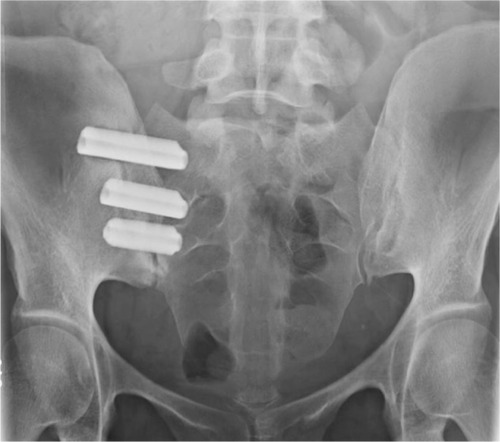
Table 1 Comparative analysis of demographics and perioperative measures between groups
Figure 3 Plot of ODI scores per patient in open sacroiliac joint fusion group.
Abbreviations: SI, sacroiliac; ODI, Oswestry Disability Index,Citation18 Preop, preoperative; Postop, postoperative
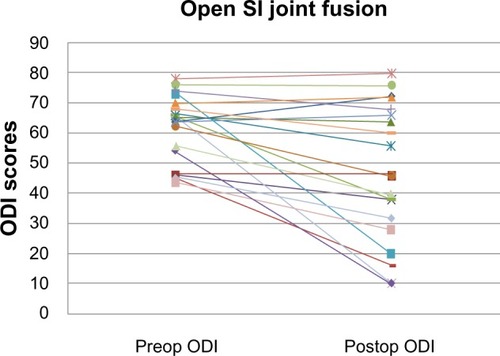
Figure 4 Plot of ODI scores per patient in the MIS SI joint fusion group.
Abbreviations: SI, sacroiliac; ODI, Oswestry Disability Index;Citation18 MIS, minimally invasive surgery; Preop, preoperative; Postop, postoperative.
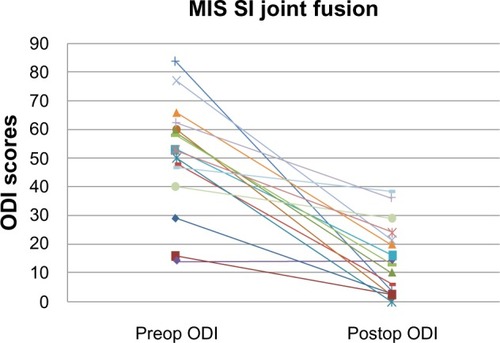
Table 2 Comparing ODI scores between groups and within groups
Table 3 Comparing patients reaching MCID between groups