
Figures & data
Figure 1 The UnoPen™ (Ypsomed AG, Burgdorf, Switzerland) disposable pen injector used in the study.
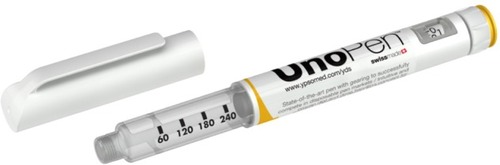
Table 1 Definition of the user groups and screening criteria for each group
Figure 2 Sequence of events during the handling tests.
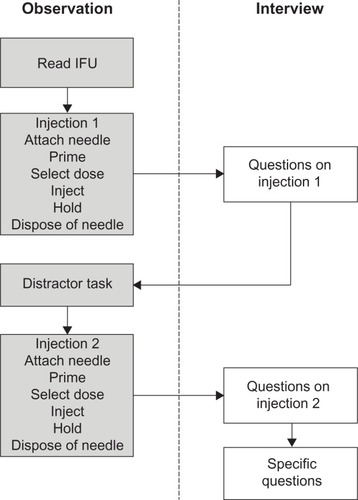
Table 2 Characteristics of participants
Table 3 Observed injection success rates for the first and second injections, per user group, n (%)
Table 4 Reported degree of confidence when using the UnoPen™: number of participants who strongly agreed or agreed that they felt confident when using the UnoPen™, n (%)
Table 5 Reported degree of comfort in using the UnoPen™: number of participants who rated their comfort in using the UnoPen™ as very comfortable or comfortable, n (%)
Table 6 Reported degree of usefulness of the IFU: number of participants who rated the IFU as very helpful or somewhat helpful, n (%)
Table 7 Observed user errors and deviations from the IFU: overview of all injections (n=71)
Figure 3 Potentially relevant user errors and deviations from the IFU, split between user steps over all user groups and all injections (n=71).
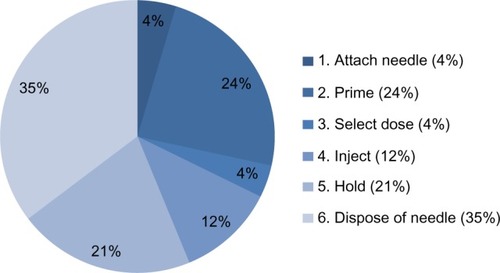
Table 8 Observed potentially relevant user errors and deviations from IFU per user group and injection