
Figures & data
Table 1 Short descriptions of technical parameters assessed for each liquid crystal display
Table 2 American Association of Physicists in Medicine Task Group-18 criteria used for radiological assessments
Table 3 Technical assessments of the different LCD models
Table 4 Reliability of image assessments for predicting liquid crystal display quality, determined with Cronbach’s alpha
Figure 1 Radiological assessments for each type of LCD, according to AAPM TG-18 criteria. Symbols indicate different LCD types; scores are represented as the mean and standard deviation on a scale from 0–10 (n=19 evaluators).
Abbreviations: AAPM, American Association of Physicists in Medicine; TG-18, Task Group 18; LCD, liquid crystal display; MP, megapixels; sd, standard deviation; CT, computed tomography; MR, magnetic resonance.
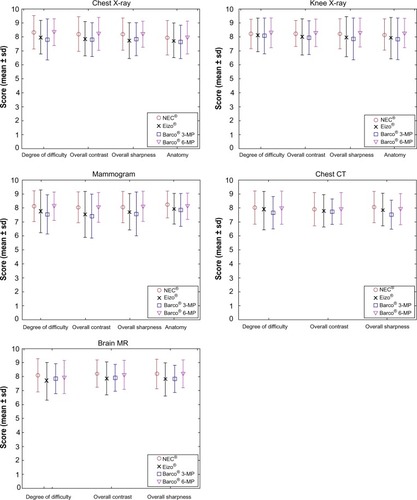
Table 5 P-values for comparisons of radiological assessments made with different liquid crystal displays