Figures & data
Figure 1 Biomechanical testing.
Notes: The peritoneum was removed from each sample to visualize the tissue that surrounded the mesh; the peritoneum was then repositioned prior to biomechanical testing. The biological sample after removal of the peritoneum and creation of the 3 cm defect with nails fixing the edges of the sample to the solid support (A). Biological sample with the peritoneum repositioned but not fixed to the mesh (B). Biological sample placed within the pressure chamber of the biomechanical testing system (C).
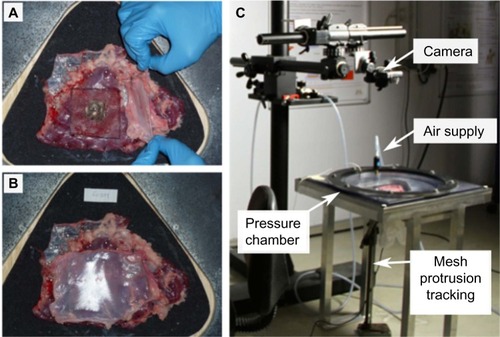
Figure 2 Mesh displacement.
Notes: Pressure was applied to the defect-containing tissue, and displacement was measured by a displacement sensor placed below the sample. Data represent the mean distance of mesh displacement through the defect, and error bars represent the standard deviation. T (test article), ProGrip™ laparoscopic self-fixating mesh; C1 (control article 1), Bard™ Soft Mesh with Tisseel™; C2 (control article 2), Bard™ Soft Mesh with SorbaFix™.
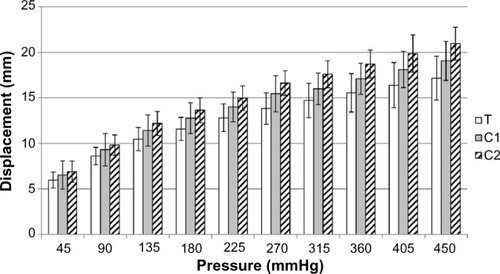
Figure 3 Mesh contact area.
Notes: Pressure was applied to the defect-containing tissue, and the contact area was measured. Data are shown as the mean percentage of mesh contact area relative to the initial mesh contact area, and error bars represent the standard deviation. T (test article), ProGrip™ laparoscopic self-fixating mesh; C1 (control article 1), Bard™ Soft Mesh with Tisseel™; C2 (control article 2), Bard™ Soft Mesh with SorbaFix™.
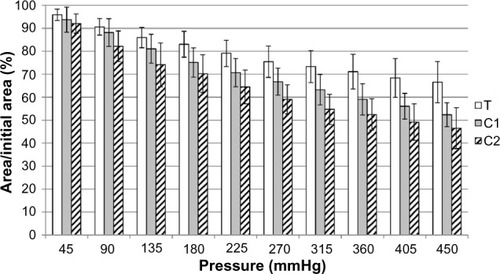
Figure 4 Ratio of final mesh surface area to initial mesh surface area.
Notes: After the maximum pressure was applied to the defect-containing tissue, the pressure was returned to 0 mmHg, and the mesh contact area was measured. Data are shown as the percentage of mesh contact area relative to the initial mesh contact area. Error bars indicate the standard deviation. *Statistically significant at P<0.001 by the Mann–Whitney test, compared to ProGrip™ laparoscopic self-fixating mesh; T (test article), ProGrip™ laparoscopic self-fixating mesh; C1 (control article 1), Bard™ Soft Mesh with Tisseel™; C2 (control article 2), Bard™ Soft Mesh with SorbaFix™.
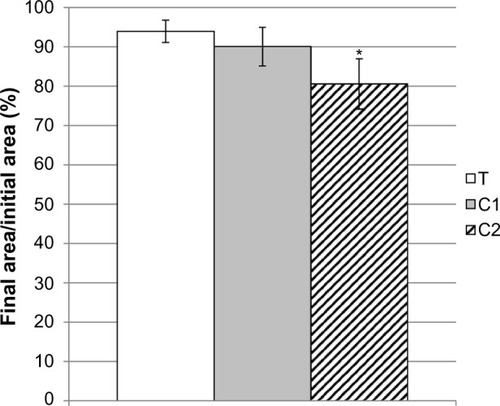
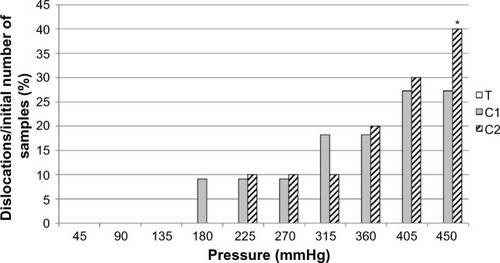
Figure 5 Mesh dislocation.
Notes: Pressure was applied to the defect-containing tissue, and mesh either remained fixed to the tissue or became dislocated. Data represent the percentage of samples with dislocated mesh. No ProGrip™ laparoscopic self-fixating mesh samples dislocated at any pressure that was tested. *Statistically significant at P=0.035 by Fisher’s exact test, as compared to the ProGrip™ laparoscopic self-fixating mesh; T (test article), ProGrip™ laparoscopic self-fixating mesh; C1 (control article 1), Bard™ Soft Mesh with Tisseel™; C2 (control article 2), Bard™ Soft Mesh with SorbaFix™.