Figures & data
Table 2 Grouping of patients according to different parameters
Table 1 Patients’ clinical profile parameters (15 boys, 15 girls)
Table 3 Grading criteria, means, and mean differences in blood pressure for test device and for both observers
Figure 1 Plot of pressure difference between the better observer and the test device, and the mean pressure in 30 patients for SBP (n=90).
Abbreviation: SBP, systolic blood pressure.
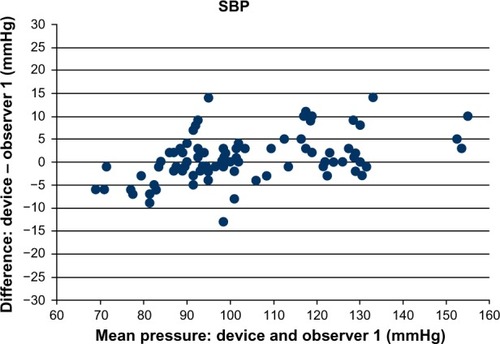
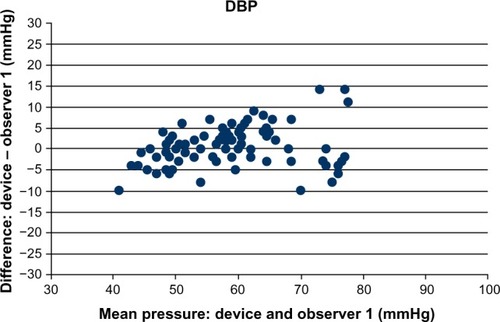
Figure 2 Plot of pressure difference between the better observer and the test device, and the mean pressure in 30 patients for DBP (n=90).
Abbreviation: DBP, diastolic blood pressure.