Figures & data
Table 1 MMP inhibitors in MS clinical development*
Figure 1 Schematic representation of MMP structure based on domain arrangement.
Abbreviations: MT-MMP, membrane-type MMP; GPI, glycosylphosphatidylinositol.
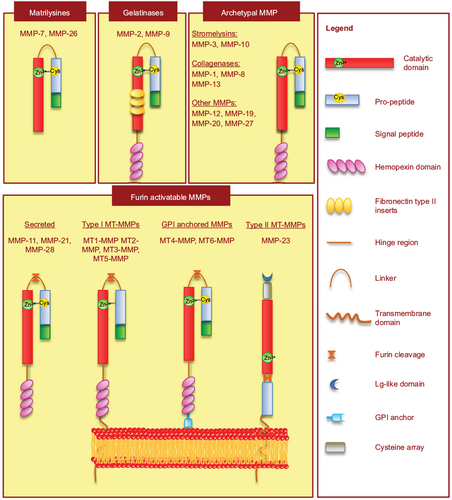
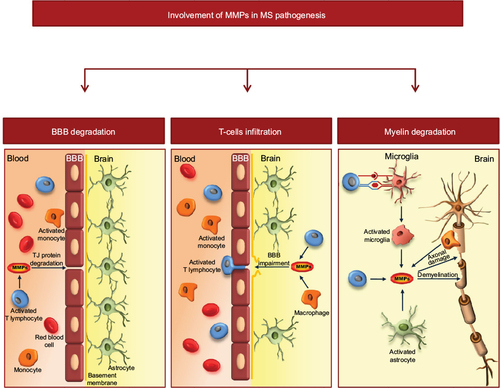
Figure 2 Schematic representation of the involvement of MMPs in MS pathology.
Notes: MMPs, and in particular MMP-9, are involved in the mechanisms of BBB disruption through degradation of TJ proteins. This allows extravasation of autoreactive CD4+ T cells into the CNS. Within the brain parenchyma, activated T lymphocytes release inflammatory cytokines and MMPs. Moreover, T cells activate microglia cells/macrophages and astrocytes to the release of proinflammatory cytokines and MMPs, which contribute to myelin degradation and axonal loss.
Abbreviations: MS, multiple sclerosis; BBB, blood–brain barrier.